
Is Bitcoin’s latest -2.3% slide a fleeting war headline reaction or a deeper shift in crypto market structure?

How is geopolitics driving Bitcoin today?
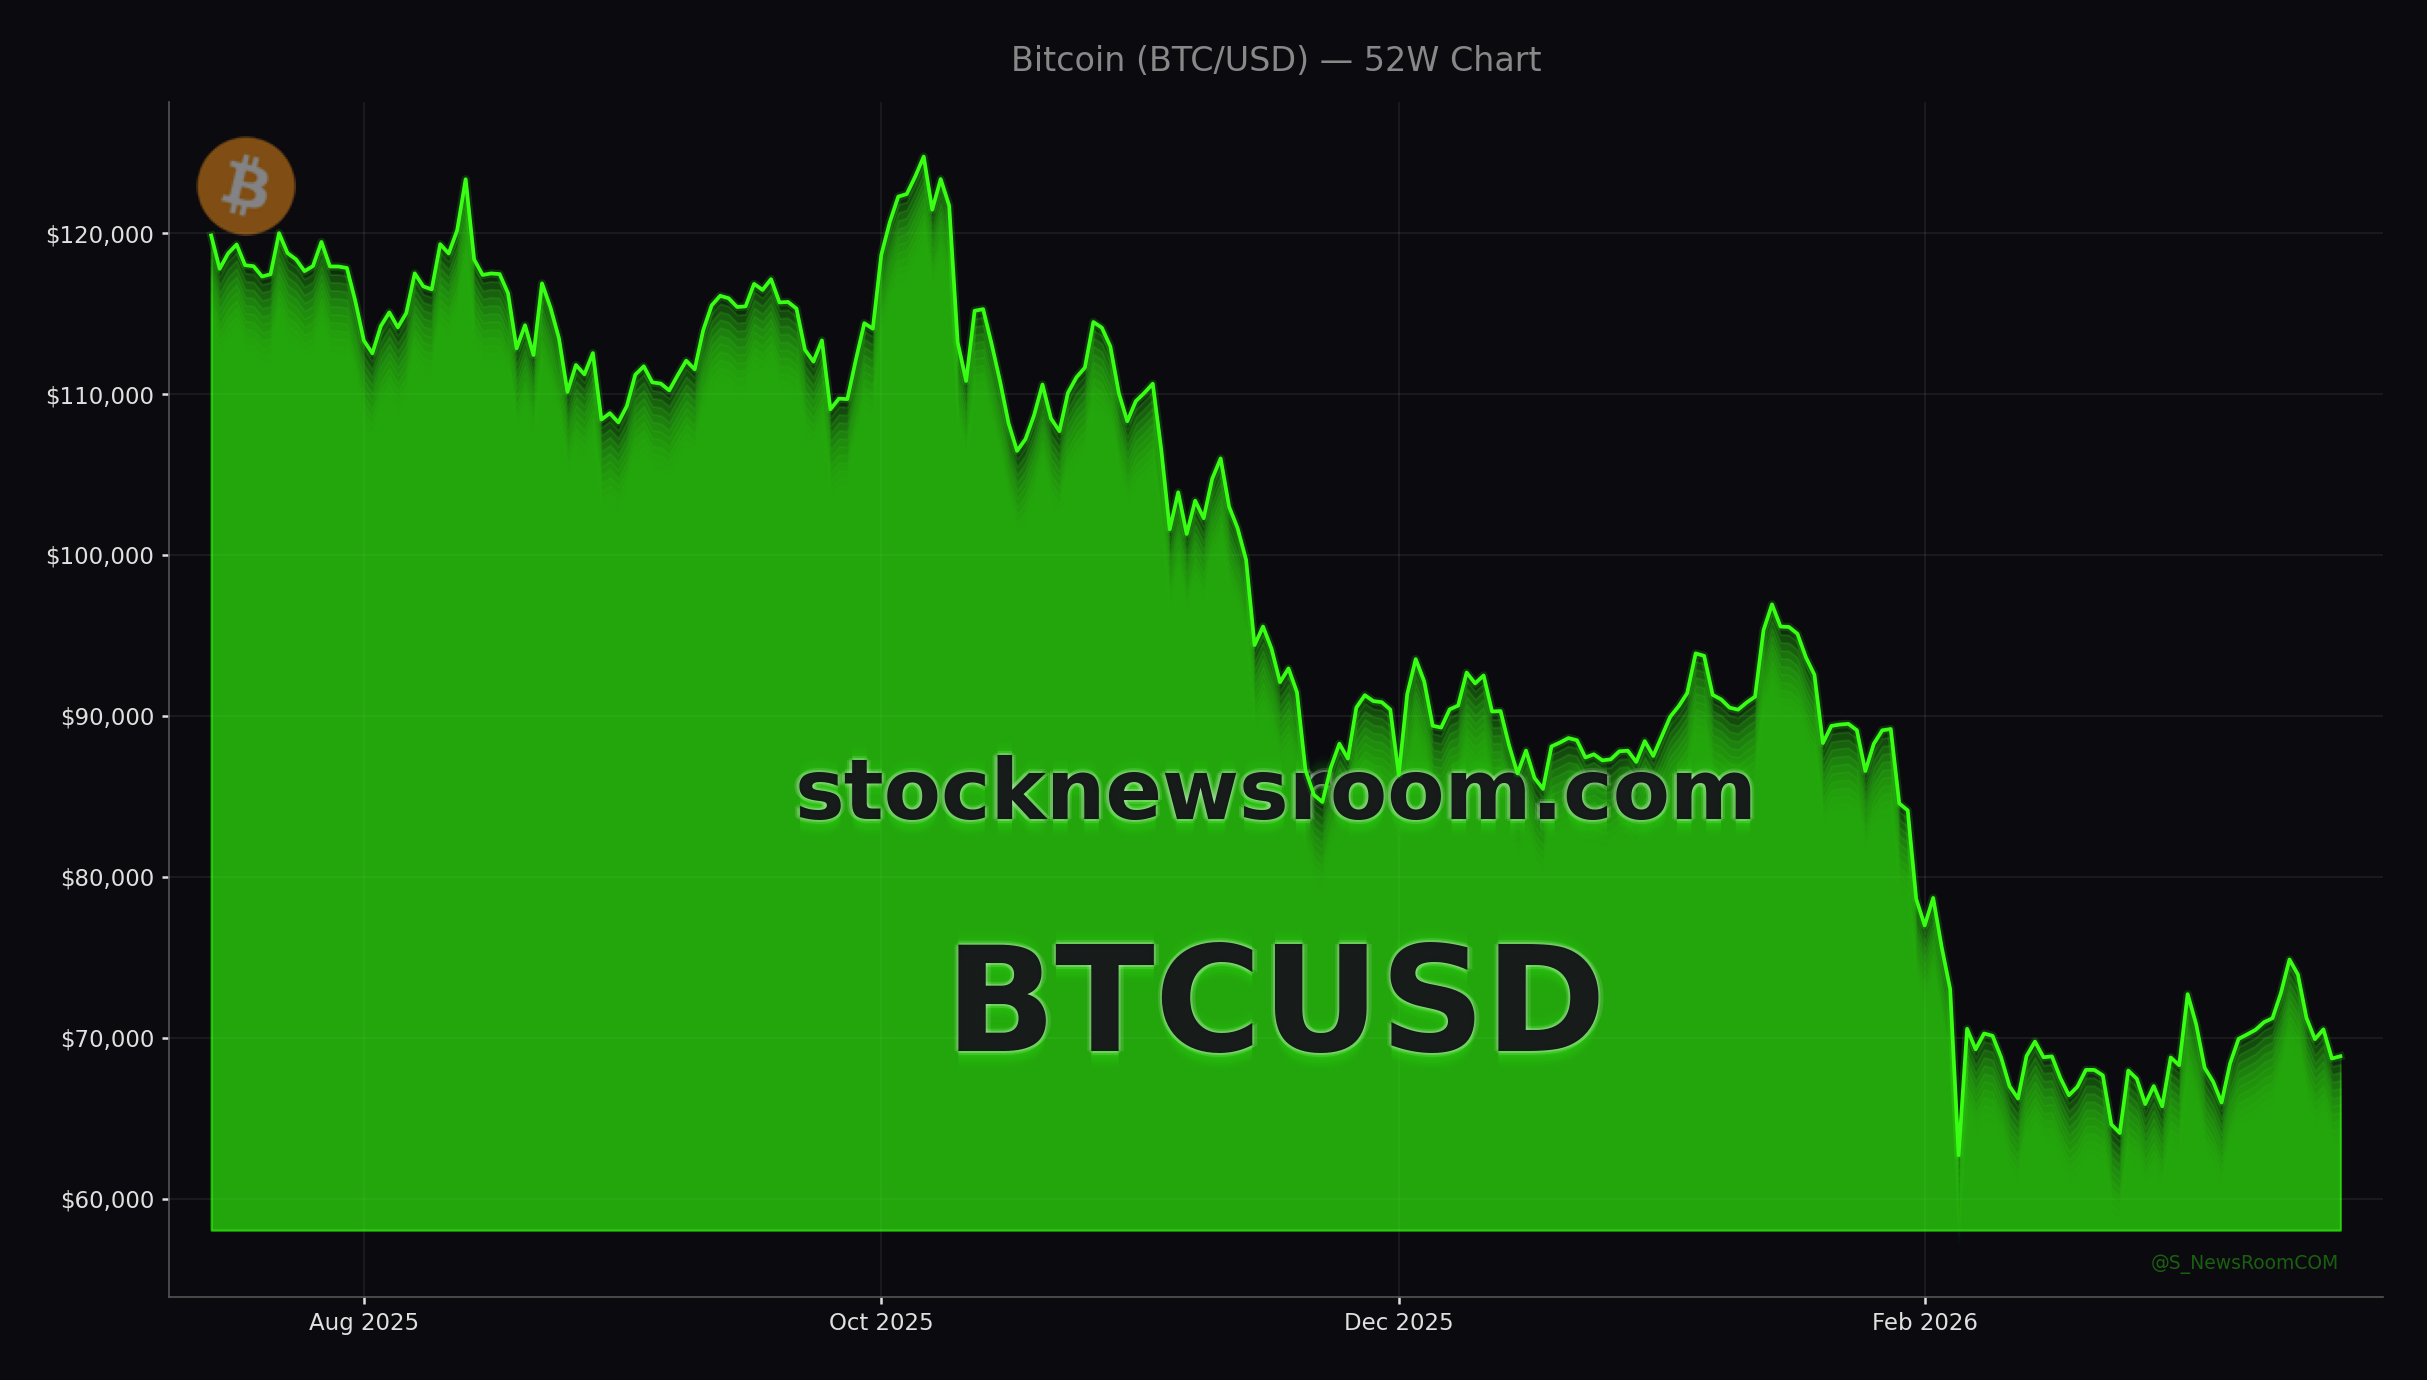
The latest leg lower in Bitcoin has been tightly linked to a sharp escalation in Middle East tensions. A late‑night social media post from President Donald Trump threatening to “obliterate” Iranian power plants if the Strait of Hormuz is not reopened within 48 hours jolted risk sentiment. In minutes, Bitcoin dropped from roughly $70,400 toward $68,200 before rebounding and then settling just under $69,000. That intraday pattern looks less like a grinding bear market and more like a fast repricing to a single, discrete headline.
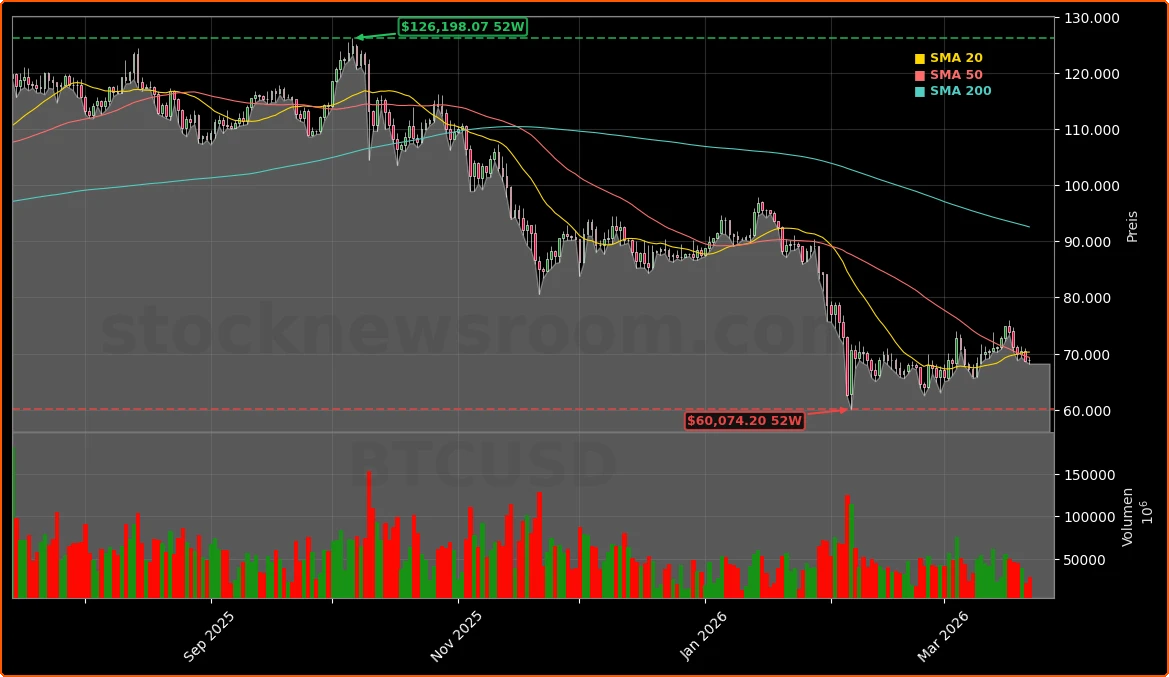
For global macro desks on Wall Street, this move reinforces a familiar pattern. Bitcoin often trades as a high‑beta risk asset that reacts first when cash equity markets are closed, then spends the next sessions deciding whether the initial knee‑jerk was an overreaction. The current trading range between roughly $62,800 and $72,600 remains intact, with repeated failures above $70,000 showing that the market has not yet secured acceptance at higher levels.
Options data underline the fragility of sentiment. Recent derivatives positioning shows put open interest overtaking calls, signaling that sophisticated traders are paying up for downside protection even as spot ETF outflows have moderated. That positioning helps explain why the latest drop was sharp but orderly rather than a cascading liquidation event.
Bitcoin Market Analysis: What are ETFs telling us?
The ETF complex has become a crucial lens for any Bitcoin Market Analysis in 2026. U.S. spot Bitcoin funds have swung from heavy inflows to meaningful outflows in recent sessions. Single‑day net redemptions reached about $164 million at one point, with products from major issuers such as BlackRock’s IBIT and Fidelity’s FBTC bearing the brunt. On another day, outflows of roughly $52 million again clustered around those same vehicles.
Elsewhere in the week, flows were mixed rather than one‑sided. Aggregate spot Bitcoin ETFs pulled in around $95 million net over five trading days, while Solana products attracted about $20 million and Ethereum vehicles saw roughly $60 million in outflows. That split shows institutional capital rotating within the large‑cap crypto universe rather than abandoning the space entirely.
For U.S. portfolio managers benchmarked to the S&P 500, those ETF patterns matter. Spot products have made Bitcoin easier to plug into multi‑asset models alongside Apple, Tesla and NVIDIA, but they also tie price action more directly to the risk appetite of registered advisors and global asset allocators. When those allocators derisk on war headlines or interest‑rate worries, Bitcoin can now feel the impact more immediately through ETF redemptions.
How resilient is the Bitcoin network itself?
While price swings dominate headlines, a new multi‑year study from Cambridge researchers offers a different dimension for Bitcoin Market Analysis: infrastructure resilience. Using more than eight million observations of Bitcoin nodes between 2014 and 2025, combined with data on 658 submarine cables and dozens of real‑world outages, the study modeled how physical disruptions affect the network.
The results are surprisingly robust. In simulated random failures of undersea cables and internet routing infrastructure, the critical threshold at which the network becomes meaningfully impaired ranged between roughly 72% and 92% of capacity loss, depending on the period. In real outage events, 87% of incidents produced a change in reachable nodes of less than 5%, with a median impact close to zero and virtually no lasting correlation to price performance.
The more serious risk lies in targeted attacks on key hubs: major transatlantic cables, large internet service providers, or data centers that host big mining pools and node clusters. In these scenarios, smaller, well‑chosen cuts can isolate significant segments of the network. Even here, however, the rising share of nodes using the Tor network provides an unexpected stabilizer, because much of Tor’s relay capacity resides in well‑connected European jurisdictions with redundant links.
How does Bitcoin stack up for U.S. investors?
From a long‑term perspective, Bitcoin still commands roughly 60% of total crypto market capitalization and remains the default “blue chip” in digital assets. Over the past decade it has vastly outperformed the S&P 500 and NASDAQ, albeit with much higher volatility. Recent analysis of market cycles suggests the current pullback, with Bitcoin trading around 40% below its October 2025 peak, fits its historic boom‑and‑bust pattern rather than signaling structural decay.
Long‑horizon strategists at major brokerages continue to frame Bitcoin as a core holding within a diversified crypto sleeve, alongside Ethereum and high‑conviction names like Solana. Commentators at large U.S. research houses argue that if institutional adoption continues apace and policy support in Washington remains constructive, scenarios in which Bitcoin eventually approaches six‑ or even seven‑figure prices per coin cannot be dismissed, even if they remain speculative.
Compared with mega‑cap growth stocks such as Apple or NVIDIA, Bitcoin offers no cash flows and therefore no traditional valuation anchor, but it also carries a distinct macro profile. It trades 24/7, responds instantly to geopolitical shocks, and now benefits from a deep, regulated ETF wrapper that can sit in the same accounts as index funds and Treasuries. For advisors building U.S. client portfolios, the practical question is not whether Bitcoin replaces equities, but whether a small, risk‑budgeted allocation improves overall risk‑adjusted returns.
In this context, the current Bitcoin Market Analysis points to a market that is nervous but not broken: geopolitical risk is high, ETF flows are choppy rather than catastrophic, and the underlying network appears more resilient than many feared. For investors who can tolerate volatility and think in multi‑year horizons, the coming quarters will show whether this consolidation below the highs becomes a springboard for the next leg higher or the start of a longer, grinding range.