Will the Bitcoin tariff shock be just a brief scare or force a move towards $60,000?
How Hard Does the Bitcoin Tariff Shock Hit the Market?
The recent Bitcoin tariff shock was triggered by a sudden tightening of U.S. trade policy. Trump plans to raise the newly introduced global base tariff from 10 percent to the legal maximum of 15 percent. The result: Risk-on assets like Bitcoin came under pressure worldwide, while gold showed new strength. The leading cryptocurrency briefly fell by up to 4.8 percent in Asian trading to around $64,300, the lowest level since February 6, before a rebound brought it back to the $66,000 range.
From a technical perspective, the picture remains damaged. Bitcoin is now about 48 percent away from its record high of over $120,000 to $126,000 last October. Year-on-year, the loss amounts to about a quarter of the market capitalization, clearly categorizing the current phase as a bear market correction. Key support levels are seen around $60,000 and at the 200-week line at around $58,500.
What Happens with Strategy and Other Major Holders?
While many retail investors are unsettled by the Bitcoin tariff shock, some institutional players are using the sell-off to buy more. The publicly traded Bitcoin holding Strategy is reportedly preparing for its 100th Bitcoin purchase and already holds over 717,000 BTC at an average entry price of $76,027. Other well-known crypto entrepreneurs like Michael Saylor continue their accumulation strategy, viewing the price declines more as a “store sale.”
At the same time, on-chain data shows significant pressure from sales by large addresses. Whale transactions on centralized exchanges have increased significantly, with some historical wallets liquidating holdings worth hundreds of millions of dollars. Open interest in Bitcoin derivatives has fallen from its yearly peak to below $20 billion, indicating a broad deleveraging. Crypto hedge funds are also increasing their cash ratios, with some temporarily reducing their exposure to Bitcoin and Ethereum to zero.
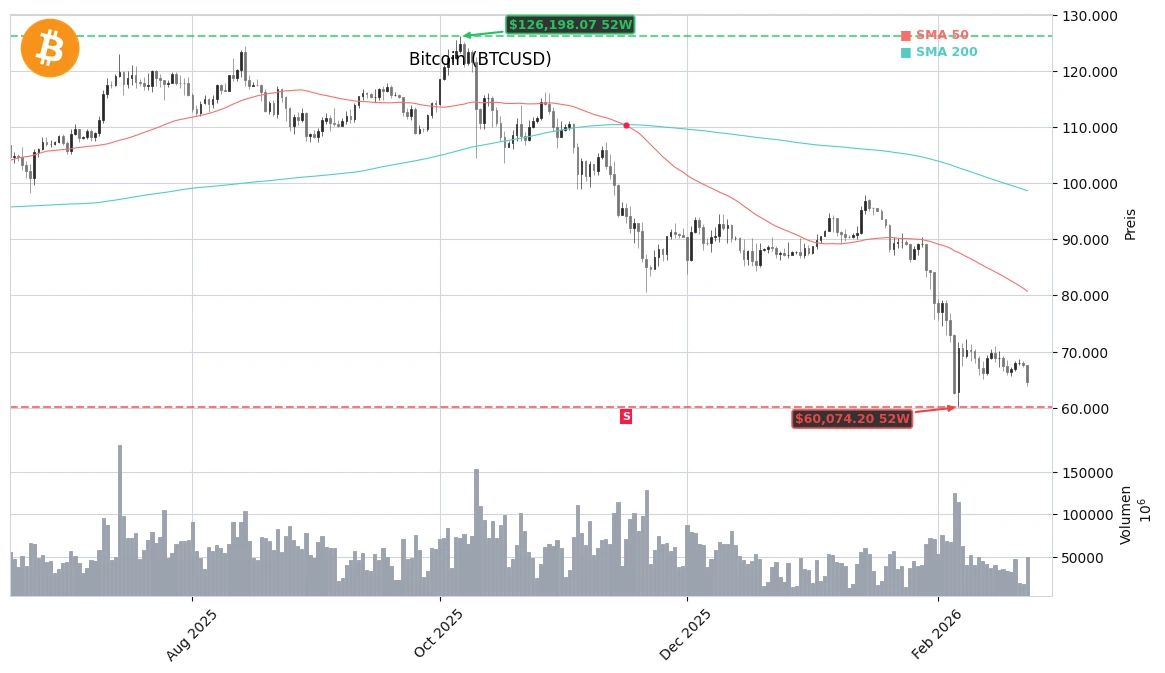
” alt=”Bitcoin Stock Chart – 252 Days Price Trend – February 2026″ loading=”lazy” style=”width:100%;height:auto;border-radius:8px;”>
How Severe Are Liquidations and Sentiment Decline?
The price drop below $65,000 triggered a wave of forced liquidations. Within 24 hours, more than 136,000 traders were liquidated, with the volume totaling around $458 to over $500 million – about 90 percent of which was from leveraged long positions. The area between $65,500 and $64,500 was particularly affected, where many stop-loss and margin levels were located and have now been “cleaned out.”
Meanwhile, the Crypto Fear & Greed Index, with a value of 5, signals “extreme fear” and marks one of the lowest levels since its introduction in 2018. The sentiment resembles the lows of the bear markets in 2019 and 2022. On-chain analysts report realized net losses for newer investors amounting to nearly $500 million per day. Nevertheless, some market observers see this pronounced risk aversion as a potential accumulation zone with an improved risk-reward profile.
Bitcoin Tariff Shock: What Does This Mean for Investors Now?
The Bitcoin tariff shock highlights how sensitive the cryptocurrency is to macroeconomic uncertainty. The combination of geopolitical tensions surrounding Iran, an unpredictable U.S. tariff policy, and shifted interest rate cut expectations weighs on demand for highly volatile assets. Spot Bitcoin ETFs in the U.S. have recorded net outflows in the billions since the beginning of the year, and inflows from institutional investors are currently insufficient to fully offset the selling pressure from whales, miners, and corporate treasuries.
“Currently, the Bitcoin price reflects less of its own story and more of global uncertainty – tariffs, geopolitics, and liquidity dictate the direction.”
— A market strategist from a European crypto broker
Bottom Line
At the same time, the discussion about Bitcoin as “digital Fort Knox” and a tool for financial freedom continues. Some strategists point to historical patterns: After significant declines, strong recovery phases have often followed in the past once the macroeconomic situation stabilized and the market structure was cleared of excess leverage. Many chart technicians see a potential short-term rebound towards $70,000 to $75,000, before further tariff and inflation shocks could lead to another test of the zone around $60,000 or even $50,000.
Related Sources
- Bitcoin slides as tariff fears hit crypto markets (Bloomberg)
- Crypto Fear & Greed Index signals extreme fear (Alternative.me)
- Deribit and CoinGlass report high crypto liquidations (CoinGlass)
- Bitcoin at Yahoo Finance (Yahoo Finance)