Is Ethereum’s latest -3.5% slide just another dip to buy or a warning that the trend is about to break?

Is Ethereum nearing a technical turning point?
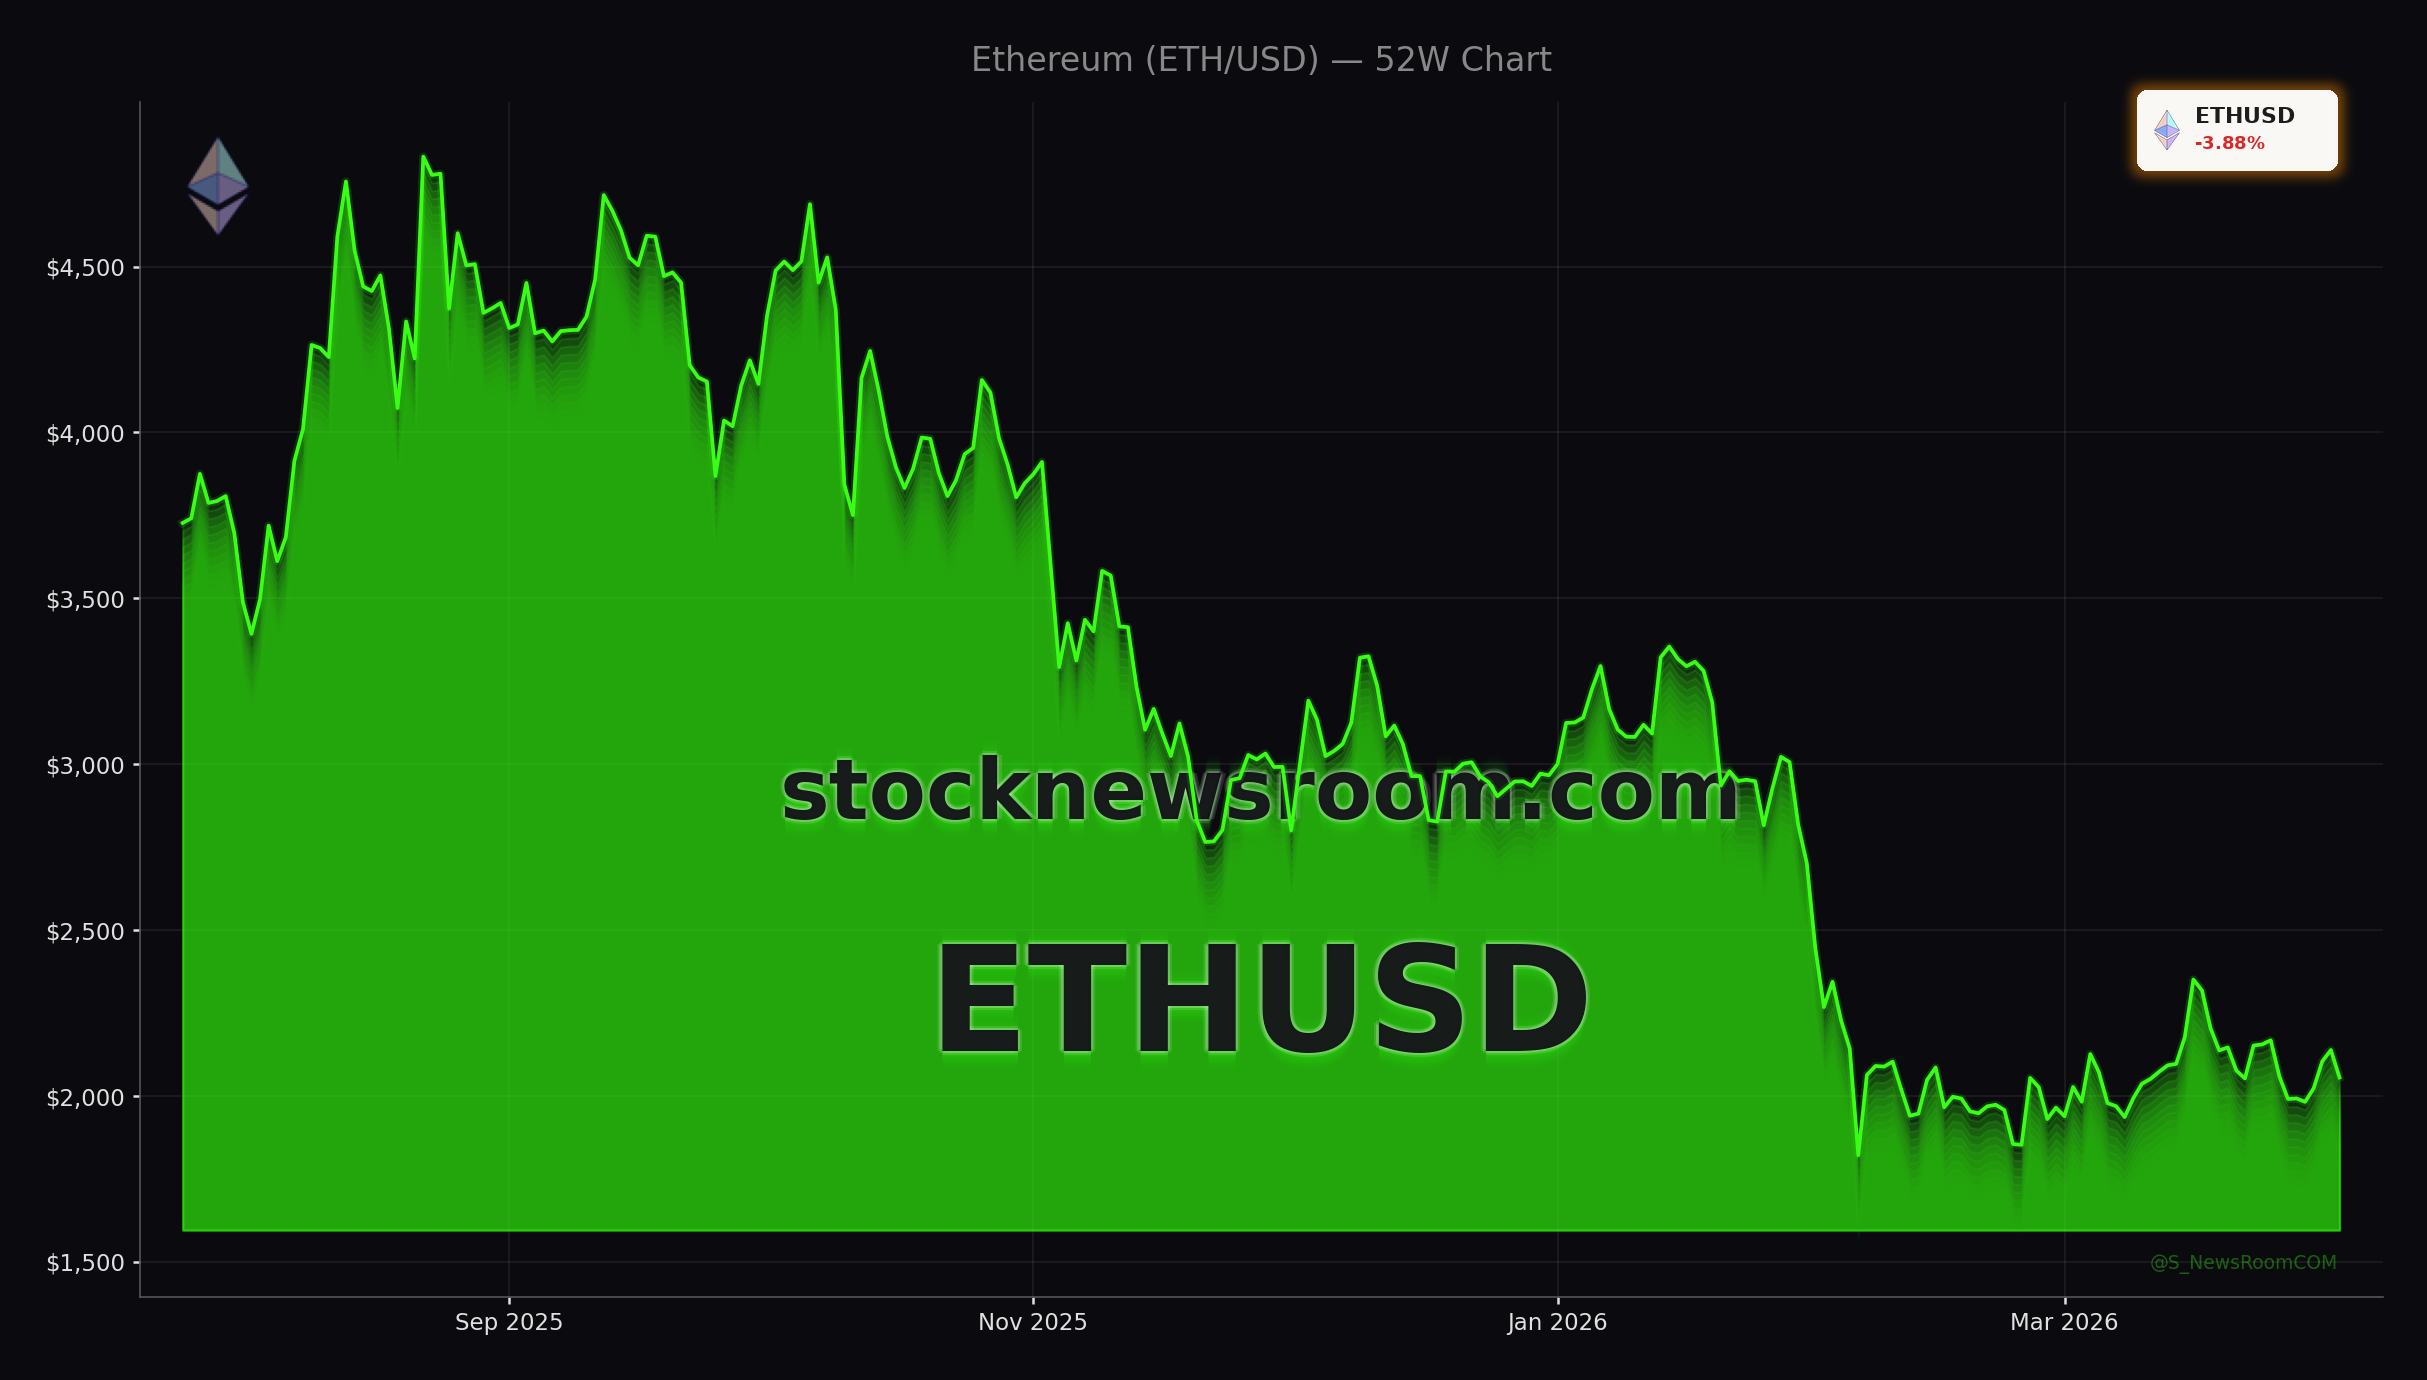
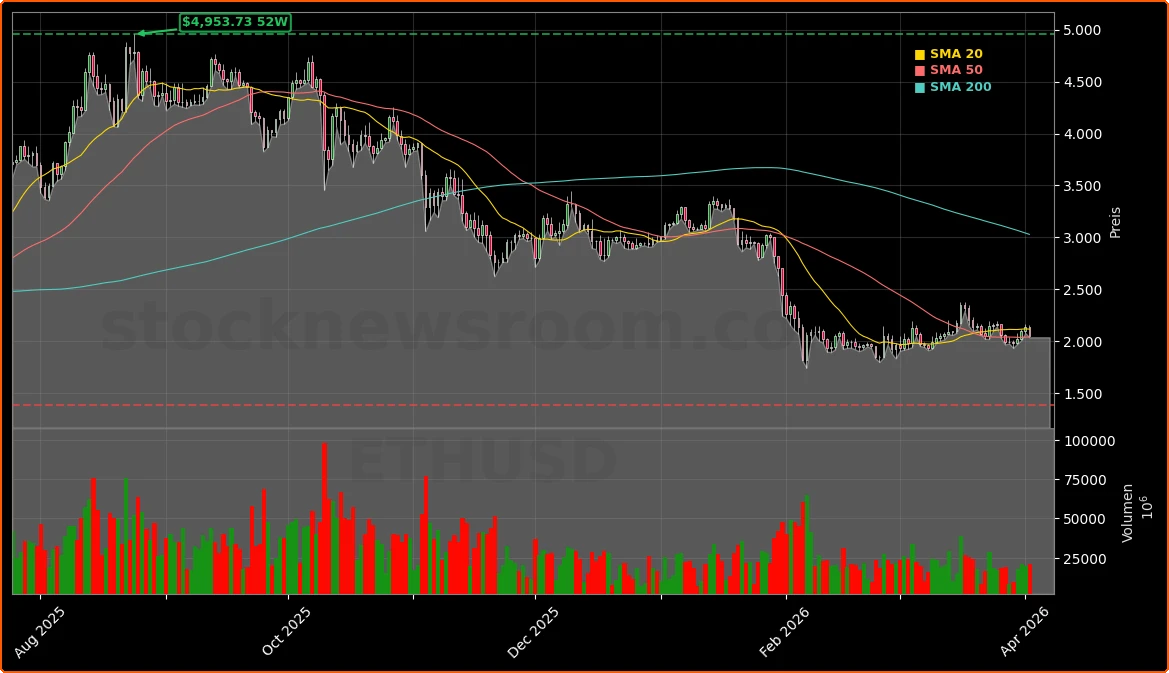
Ethereum has spent months under sustained selling pressure, but the technical picture in early Q2 2026 is starting to shift. An ascending support trendline that developed through March shows ETH printing higher lows after a long sequence of lower highs, hinting that bears may be losing momentum. Price has compressed in a $2,000–$2,200 band, with recent action around $2,044–$2,055 resembling accumulation rather than capitulation. This Ethereum Market Analysis focuses on whether that structure can support a climb toward the psychologically important $3,000 mark.
A key hurdle is the 50-day exponential moving average (EMA), which has historically validated short- to medium-term direction. ETH is currently hovering just below this dynamic barrier and testing it repeatedly. Each retest chips away at resistance, increasing the odds of a breakout if buyers can sustain pressure. However, any upside move that fails to reclaim and hold above the 50 EMA is best viewed as a relief rally, not a confirmed trend change.
On shorter intraday time frames, ETH recently pushed above $2,020 and briefly challenged resistance near $2,150 before sellers stepped in again. The price slipped back under a short-term triangle support around $2,135, and momentum indicators like the hourly MACD and RSI have turned mildly bearish, reinforcing the idea of a cooling phase after the bounce.
What levels matter most for U.S. traders now?
From a trading perspective, this Ethereum Market Analysis highlights a clear set of levels. On the upside, initial resistance sits in the $2,120–$2,150 range, followed by a heavier supply zone from $2,200 to $2,250. A decisive close above $2,250, backed by stronger volume, could open a path toward $2,320–$2,350 as the next target band, with $2,400–$2,600 emerging as the first major structural obstacle on the way to $3,000.
To the downside, the immediate support area lies around $2,080–$2,050. A clean break below $2,050 would expose the $2,000 handle, and further weakness could drag ETH toward roughly $1,965, with a deeper floor near $1,920. For short-term traders, these zones will likely define risk management, while longer-term investors may see dips into this region as potential accumulation opportunities given the broader utility case for the network.
Despite the near-term volatility, Ethereum remains central to the tokenization and decentralized finance narratives. Research projecting that the tokenized asset market could grow from roughly $19 billion today to as much as $11 trillion by 2030 positions Ethereum as a key infrastructure layer, alongside competitors like Solana and established megacap tech names such as NVIDIA and Apple that underpin the digital economy.
How does Ethereum stack up against Bitcoin and rivals?
For U.S. portfolios on Wall Street, the current pullback comes after a year in which ETH has lagged Bitcoin. Estimates indicate that in 2026 so far, Bitcoin is down about 20%, while Ethereum has dropped closer to 30%, reflecting a higher beta profile and more sensitivity to risk-off swings across the NASDAQ and broader crypto complex. Even so, ETH still holds its role as the premier smart contract platform, with real-world use cases from gaming and NFTs to decentralized finance and tokenized securities.
Institutional access to Ethereum exposure is also evolving. Products like the Grayscale Ethereum Staking ETF, which has adopted a refined benchmark methodology for valuing Ether, and multi-asset vehicles such as the Grayscale CoinDesk Crypto 5 ETF, which includes Ether-USD among its core holdings, are designed to improve price transparency and reduce tracking distortions. For investors who prefer traditional brokerage accounts over direct wallet custody, this ETF landscape is becoming a significant bridge between the crypto market and the S&P 500 investor base.
Analyst commentary on ETH-specific ETFs has generally converged on a cautious short-term stance but a constructive long-term thesis. Recent research on Ethereum-focused funds maintains a “Hold” recommendation in light of the roughly 60% drawdown from cycle highs and the current risk-off environment, while still emphasizing ETH’s unique position in staking yield, network effects, and developer activity.
What does this Ethereum Market Analysis mean for long-term investors?
For buy-and-hold investors building diversified crypto allocations alongside equities like Tesla and NVIDIA, Ethereum’s role remains that of a core Layer 1 asset. Many long-term strategies recommend Bitcoin as the cornerstone, with Ethereum as the second foundational holding due to its dominant smart contract ecosystem and potential to integrate with mainstream financial systems. The recent U.S. regulatory shift that classified several large cryptocurrencies as digital commodities has also put staking on firmer legal footing, which may further support ETH’s yield-driven investment case.
Repeated tests of the 50-day EMA and gradually higher lows show that sellers are losing the tight grip they held over Ethereum for much of the past year.— StockNewsroom.com Research Desk
In this context, the current Ethereum Market Analysis suggests that market structure is transitioning from panic selling toward equilibrium, with shrinking sell-side volume and higher lows pointing to a maturing base. A confirmed break and sustained hold above the 50 EMA, combined with acceptance above the $2,400–$2,600 zone, would strengthen the argument for a medium-term march toward $3,000. Until then, volatility is likely to remain elevated, but the risk-reward profile is becoming more compelling for patient investors with multi-year horizons.