
Is gold still a safe haven in crises, or has it quietly morphed into just another crowded macro risk trade?

Why is gold falling instead of acting as a haven?
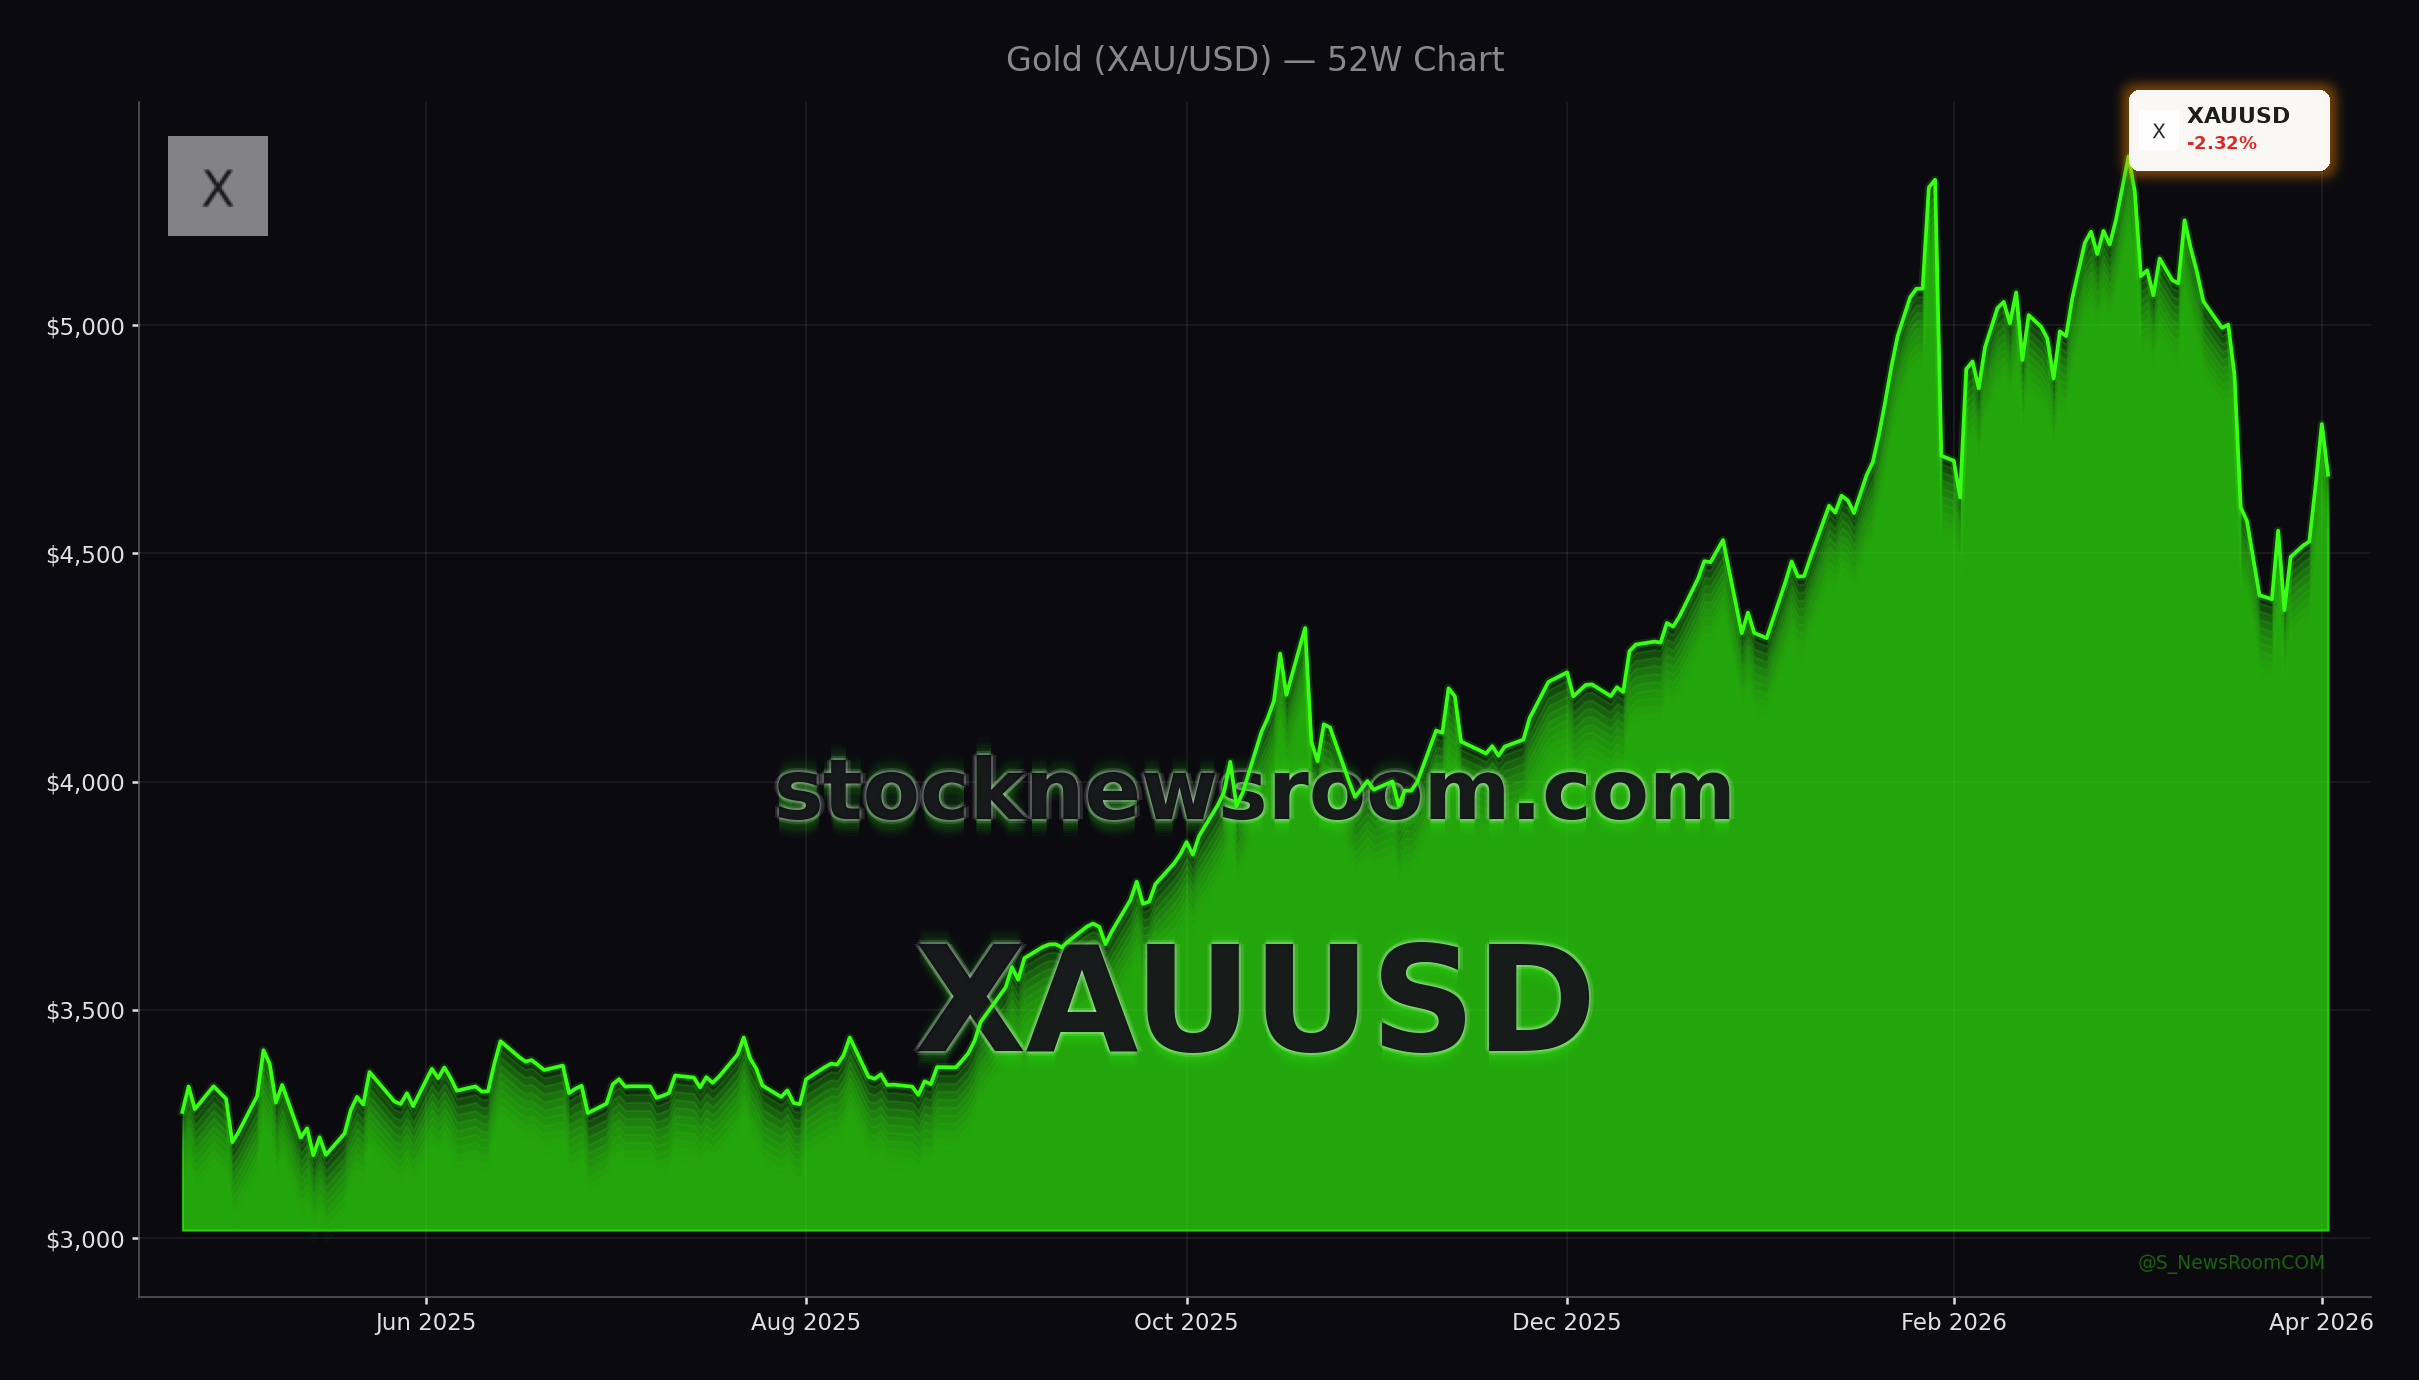
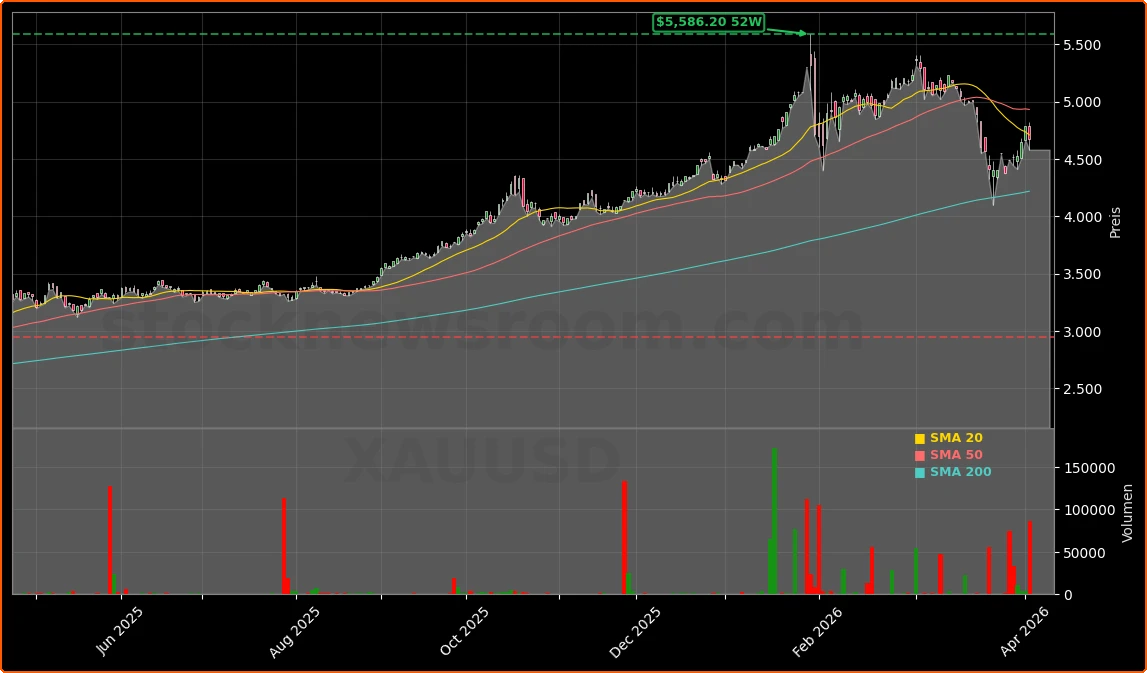
The latest leg lower in XAU, with spot gold slipping about 3.25% to roughly $4,656 after a failed test of its 200‑day moving average, underlines how crowded the safe‑haven trade had become. Over recent weeks, gold rallied sharply as energy prices spiked and war headlines dominated, drawing in retail buyers and momentum funds. With positioning stretched, even a modest shift in risk sentiment and a stronger U.S. dollar have triggered profit‑taking and forced liquidations, pushing prices down rather than up in response to bad news.
From a macro standpoint, higher real yields are also weighing on bullion. Rising Treasury rates increase the opportunity cost of holding a non‑yielding asset like gold, and a firmer dollar amplifies the pressure. That helps explain why gold is retreating alongside other risk assets, instead of decoupling as a classic safe haven. Technically, traders are now watching support zones in the $4,300–$4,100 range, where earlier corrective lows were formed, as the next potential line of defense.
Gold Market Analysis: Has gold turned into a risk asset?
One of the most striking shifts in this Gold Market Analysis is how closely gold has traded with broader risk sentiment since the latest Middle East escalation. After a brief haven spike, gold and silver sold off in tandem with equities, echoing the price action seen during recent macro shocks. That correlation breakdown versus the traditional “risk‑off” pattern has been especially visible on days when the S&P 500 and NASDAQ slide while the U.S. dollar index and Treasury yields march higher.
In that environment, gold at times has traded more like a leveraged macro hedge fund position than a conservative store of value. Silver’s recent 39% two‑day drawdown and gold’s roughly 16% pullback highlight how brutal the volatility can be. For options traders, that surge in metal volatility is both a threat and an opportunity: theta‑decay strategies are getting punished, but directional traders and volatility buyers can find attractive setups as the market chops sideways in a broad range, reminiscent of the post‑oil‑shock 1970s rather than the smooth uptrend of 2024–2025.
What does this mean for Bitcoin and other assets?
The latest moves also reshape how investors compare gold with crypto. Bitcoin is often dubbed “digital gold”, yet this time both Bitcoin and bullion have been falling together as risk aversion rises and investors flock to cash and the U.S. dollar. That co‑movement suggests that in stress phases, markets are treating both assets as part of the same speculative bucket rather than as distinct hedges. For U.S. investors overweight mega‑caps like NVIDIA, Tesla or Apple, that matters: a portfolio that combines high‑growth tech, Bitcoin and gold may deliver less diversification than models based on earlier, more stable correlations assumed.
At the same time, derivatives and structured products linked to gold are seeing sharp swings in mark‑to‑market values. Volatile trading in gold ETFs and futures is reinforcing intraday moves, while miners and alternative‑asset platforms tied to precious metals are reacting with their own idiosyncratic risks.
How are miners and platforms exposed?
While gold itself is correcting, listed companies that monetize bullion demand are seeing mixed fortunes. Shares of Gold.com (GOLD), a U.S. alternative‑asset platform offering precious metals and collectibles, have been volatile in March. After a period of strong performance powered by higher gold prices and platform expansion, the stock has recently logged outsized down days; in one late‑March session it slipped more than 3% and in another more than 4%, underperforming the broader market.
Fundamentally, the company’s wholesale and ancillary services, which account for nearly 80% of revenue, are supporting scalable, recurring income, and a string of acquisitions has expanded its direct‑to‑consumer reach. That has led some on Wall Street to highlight its long‑term growth prospects versus more cyclical gold miners. However, insider selling and the worst week for gold prices since the early 1980s have reminded investors that earnings and multiples can compress quickly when bullion reverses. Analyst commentary from firms such as Zacks Investment Research emphasizes both the structural growth opportunity in alternative‑asset platforms and the risk that valuations may look stretched if the current correction deepens.
How should portfolios use gold now?
Despite the short‑term pain, many institutional allocators still view gold as a strategic portfolio diversifier rather than a short‑term trade. Guidance from the World Gold Council and private banks commonly centers on a 5–10% allocation to gold across physical holdings, ETFs and, for sophisticated investors, futures or options. Physical gold offers no counterparty risk but involves storage and premiums over spot, while gold ETFs provide liquidity and easy integration into brokerage accounts. Futures add leverage but come with roll costs and higher risk, and gold miners layer corporate balance‑sheet risk on top of metal prices.
Macro expectations help frame this Gold Market Analysis. On Wall Street, a growing camp anticipates that softening U.S. labor data will eventually force the Federal Reserve into a more dovish stance, especially if stagflation risks intensify. In that scenario, a peak in real yields and a weaker dollar could reignite demand for gold and reverse some of the recent liquidation. Traders are watching levels near $4,807 as a first technical trigger for a sustainable rebound; a break above that area could open a path back toward $5,300 over time.
Related coverage
For a deeper look at how the latest pullback fits into the bigger picture, including whether the surge above $5,000 was a durable regime shift or a bull trap, see Gold Price Record Warning Above $5,000 Shocks Wall Street. The behavior of gold cannot be separated from energy markets either; the sharp rally in crude has reshaped inflation expectations and terms of trade for resource‑rich economies. Our analysis of these dynamics is available in WTI Oil Price Surge After Middle East Shock, which explores whether the latest WTI spike is a fleeting geopolitical reaction or the start of a structurally higher oil regime.
In conclusion, this Gold Market Analysis suggests that today’s price slide is less a verdict on gold’s long‑term role and more a function of crowded positioning, rising yields and dollar strength. For diversified investors, gold still offers valuable protection against stagflation and monetary policy surprises, but it is behaving more tactically than many models assume. The next phase of Fed policy and labor‑market data will likely determine whether the current correction becomes a buying opportunity or the start of a longer consolidation range.