Can Solana’s booming on-chain activity offset cooling ETF inflows, or is the recent price slide only just getting started?
How are Solana ETFs reshaping demand?
Spot Solana ETFs, launched in late October 2025, initially saw powerful demand, with average net inflows above $100 million per week in the first five weeks as the token traded near $188. Since early December, however, net inflows have slowed sharply to roughly $20–25 million per week while SOL slid to the mid‑$80 range. During the four‑month drawdown, the products even recorded two weeks of net outflows totaling $11.3 million, a modest reversal but a clear sign that some early buyers took profits or cut risk.
Compared with spot Bitcoin and Ethereum ETFs, which posted four straight months of net outflows over the same period, Solana’s vehicles still look relatively resilient. For a US investor building crypto exposure through regulated wrappers, this Solana ETF-Analyse suggests the asset has retained a core base of long-term holders, even as speculative flows fade. Yet ETF demand alone has not been enough to defend price, underscoring how sentiment in the broader digital-asset complex still dominates.
Is on-chain activity outgrowing valuation?
While ETF inflows have cooled, on-chain fundamentals are moving the opposite way. Over the last 24 hours, applications on the Solana Kryptowaehrung ecosystem generated about $3.1 million in revenue, edging out Ethereum’s $2.95 million. Active addresses surged to roughly 2.17 million versus 682,236 on Ethereum, and Solana’s total fees reached $722,706 compared with $356,438 on its larger rival. Decentralized exchange volume on Solana now leads competitors despite a lower total value locked, signaling intense transactional usage even at depressed prices.
The network’s real-world asset (RWA) segment has also hit a record $1.71 billion, up 45% in 30 days, although Ethereum still captures about $15 billion of the roughly $25.37 billion RWA market. Several US-facing research shops, including The Motley Fool, have highlighted Solana’s speed and low fees as tailwinds for stablecoin issuers and tokenization plays, arguing it could narrow the gap with Ethereum over time. For portfolios heavy in NASDAQ-style growth exposure and even names like NVIDIA or Apple, this raises the prospect of Solana functioning as a high-beta, infrastructure‑style complement to traditional tech.
Solana ETF-Analyse: Where could the bottom form?
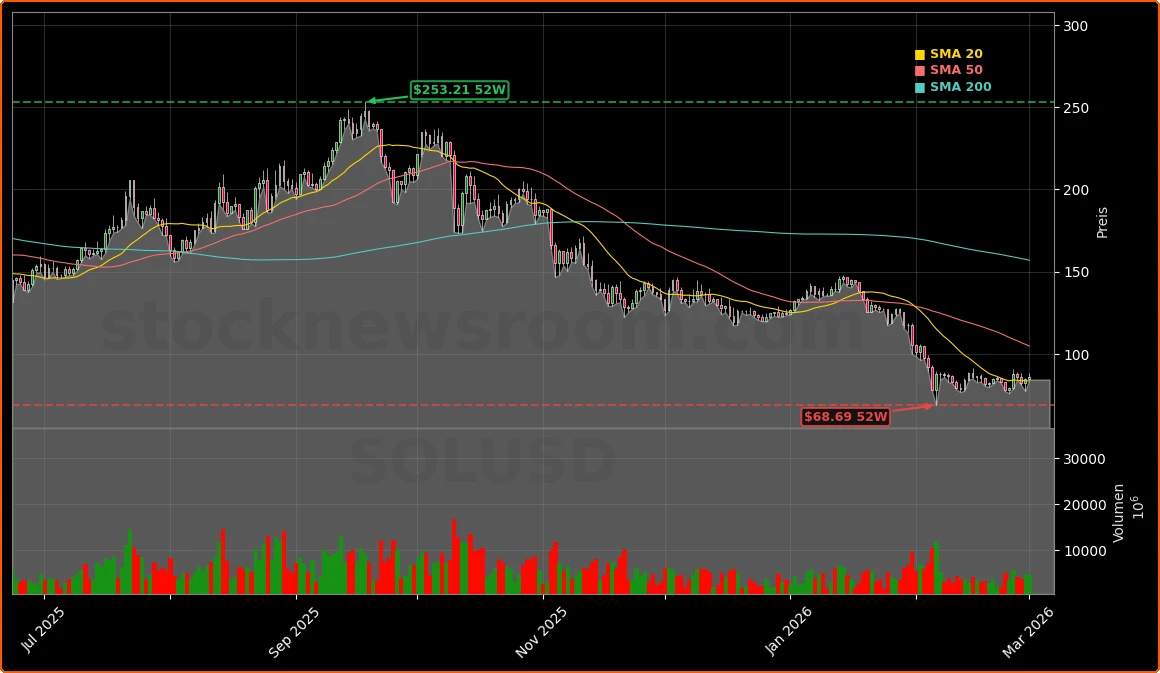
Technically, SOL is well off its $295 peak and the $188 level seen around ETF launch. On the weekly chart, the token has already tested a key demand zone between $51 and $80, aligning with a 0.75 Fibonacci retracement band in the $60–$70 area that historically corresponds to deeper pullbacks within broader uptrends. A weekly resistance ceiling remains near $120; sustained trade below that level keeps the medium‑term setup cautious.
On-chain realized price data shows more than 6% of total supply last moved within the current price band, forming a dense cost‑basis cluster that can act as support. The next major realized cluster, above 3% of supply, sits in the $20–$30 range. For a Solana ETF-Analyse, this implies that if the $51–$80 zone fails, downside could accelerate into that lower fair‑value gap, but ETF holders have not yet capitulated in size. No major Wall Street bank such as Goldman Sachs, Morgan Stanley, Citigroup or RBC Capital has published a high-profile rating on SOL ETFs, leaving the narrative driven more by crypto‑native research than traditional analyst price targets.
How should US investors position now?
US and international investors weighing SOL against other high‑beta assets like Tesla or growth software names must balance structural adoption against volatility. Several long‑only research outlets see Solana and a handful of peers as potential rebound candidates in 2026, especially if mainstream tokenization and stablecoin volumes migrate to faster chains. At the same time, the 72% drawdown from the peak and the presence of a weekly fair‑value gap down at $22–$29 make risk management critical, particularly for portfolios already exposed to cyclical tech and crypto‑sensitive equities.
Conclusion
From a portfolio‑construction viewpoint, this Solana ETF-Analyse indicates that spot ETFs provide cleaner access for institutions operating under strict mandates, similar to how Bitcoin futures ETFs opened the door for pension funds and RIAs. For now, the combination of slowing but positive ETF inflows, record on-chain activity and compressed price action points to a measurable gap between usage and valuation. Whether that gap closes via a renewed rally in SOL or a normalization of network metrics will be the deciding factor for investors considering new positions.
Further Reading
- Solana Kryptowaehrung (SOL-USD) Quote (Yahoo Finance)
- Crypto Crash Playbook: 2 High-Conviction Buys to Consider Before the Rebound (The Motley Fool)
- 2 Top Altcoins to Consider Buying Before Prices Rebound (The Motley Fool)