Is Opendoor’s latest surge the start of a real turnaround, or just another momentum trade outrunning the fundamentals?

What’s Driving OPEN’s 10% Rally?
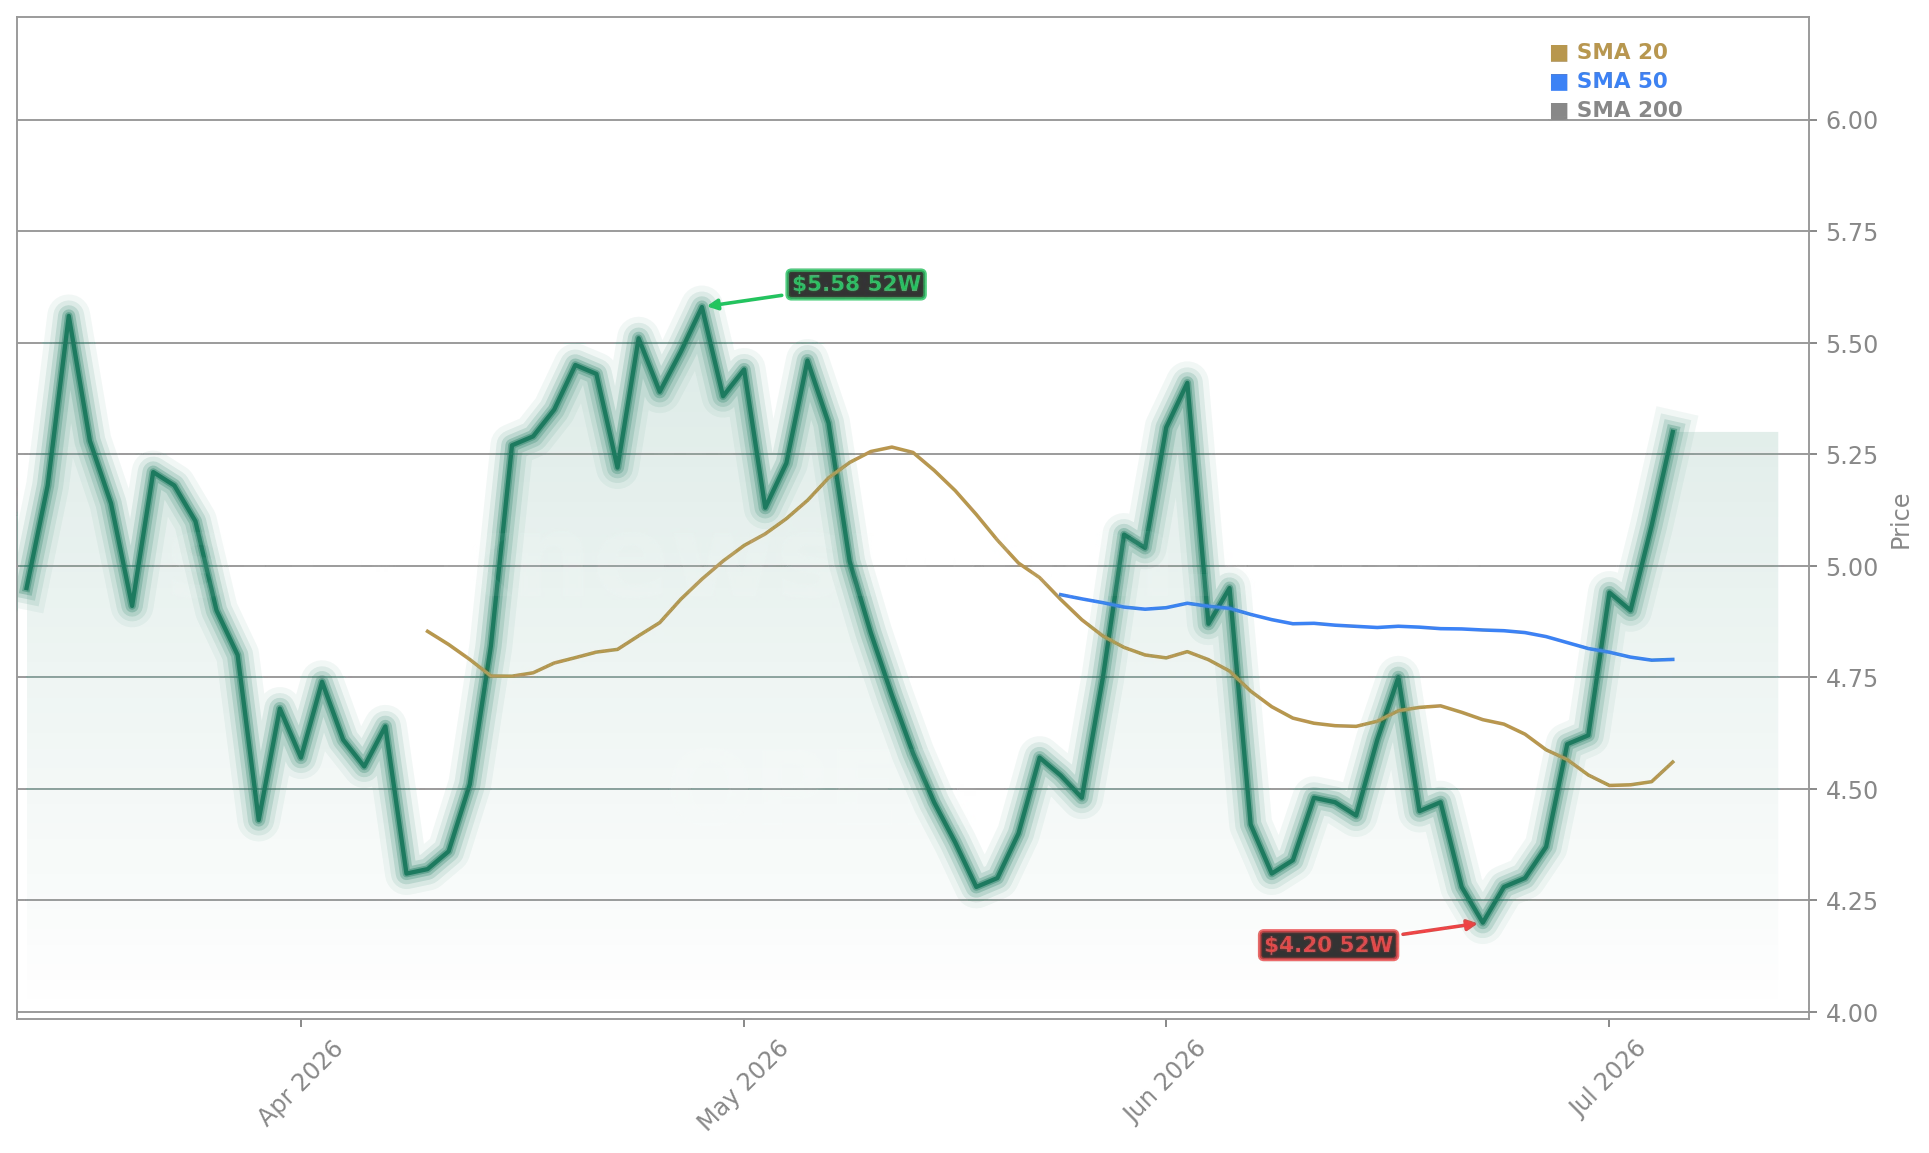
Opendoor Technologies Inc. jumped to $5.28 — up 10.23% from $4.79 — in Thursday’s intraday session, outperforming both Zillow Group and Offerpad Solutions despite weak macro housing data. While housing starts fell to 1.18 million annualized in May and existing home sales slipped to 4.09 million in June, OPEN’s move appears driven by retail flow, Reddit sentiment (scores 66–74), and index inclusion effects: the stock entered the Russell 3000 on May 27, with the change effective June 26. Notably, volume spiked 142% above its 50-day average, and Benzinga Edge awarded OPEN a 98.78 momentum score — the highest among iBuyers.
Opendoor Turnaround: Real Progress or Narrative Over Numbers?
The bull case centers on operational improvements under CEO Kaz Nejatian: aged inventory dropped from 51% to 10%, acquisition contracts hit 5,000 — the highest since 2022 — and resale contribution margins improved every month since September 2025. Still, Q1 2026 revenue fell 38% year over year to $720 million, and adjusted net loss totaled $49 million. Gross margin rose to 10.0%, but operating cash burn hit negative $246 million. RBC Capital Markets recently reiterated its ‘Underperform’ rating on OPEN, citing “unproven unit economics” and “elevated dilution risk” with 964.7 million shares outstanding. Meanwhile, Citigroup maintains a $4.82 price target — now below the current $5.28 quote — underscoring valuation tension.
Why Is Zillow Lagging While OPEN Soars?
Zillow Group posted $46 million in net income and 18% revenue growth in Q1 — yet gained just 2% to $32.96. Its 73.3% gross margin and $182 million adjusted EBITDA starkly contrast OPEN’s $49 million adjusted net loss and zero TTM P/E. Zillow’s model — a digital tollbooth for home search — carries minimal balance sheet risk, while Opendoor Technologies Inc. holds $193 million in current convertibles and carries inventory risk. That divergence highlights how the Opendoor Turnaround narrative is trading on hope, not profitability. Morgan Stanley analysts note: “Zillow’s forward P/E of 15x offers better risk-adjusted exposure to housing recovery than OPEN’s 3.56 beta and GAAP unprofitability.”
How Does Offerpad Fit Into This Dynamic?
Offerpad Solutions gained just 4% to $5.22 — trailing OPEN but outpacing Zillow — despite deeper fundamentals: TTM EPS of -$11.70, 50% YoY revenue decline, and 59% YTD share decline. Its lack of momentum underscores that retail interest is selective: OPEN’s rally reflects a targeted bet on the Opendoor Turnaround, not broad iBuyer optimism. The SPDR S&P Homebuilders ETF (XHB), which excludes both OPEN and OPAD, rose just 0.7% — further isolating OPEN’s move as idiosyncratic. With OPEN’s 52-week range stretching from $0.73 to $10.87, today’s rally sits well below its high but above its 200-day moving average ($5.85), making $5.50 near-term resistance and $4.50 key support.
What’s Next for the Opendoor Turnaround?
The Opendoor Turnaround narrative is trading on hope, not profitability.— Morgan Stanley analysts
The next milestone is Q2 2026 results — due in early August — where management’s adjusted EBITDA breakeven guide will be tested. Any miss could trigger a sharp reversal, given OPEN’s 3.56 beta. Analysts at Goldman Sachs warn that “inventory velocity remains vulnerable to rate sensitivity,” and housing affordability remains near a 20-year low. Still, the Opendoor Turnaround remains the only iBuyer story with a near-term path to cash-flow neutrality. For investors, position sizing must remain modest — and diversification via XHB remains prudent for broad housing exposure without single-stock volatility.