
Is Solana’s latest bounce above $85 the start of a real trend shift or just another fragile crypto head fake?

How strong is the current Solana Market Analysis rebound?
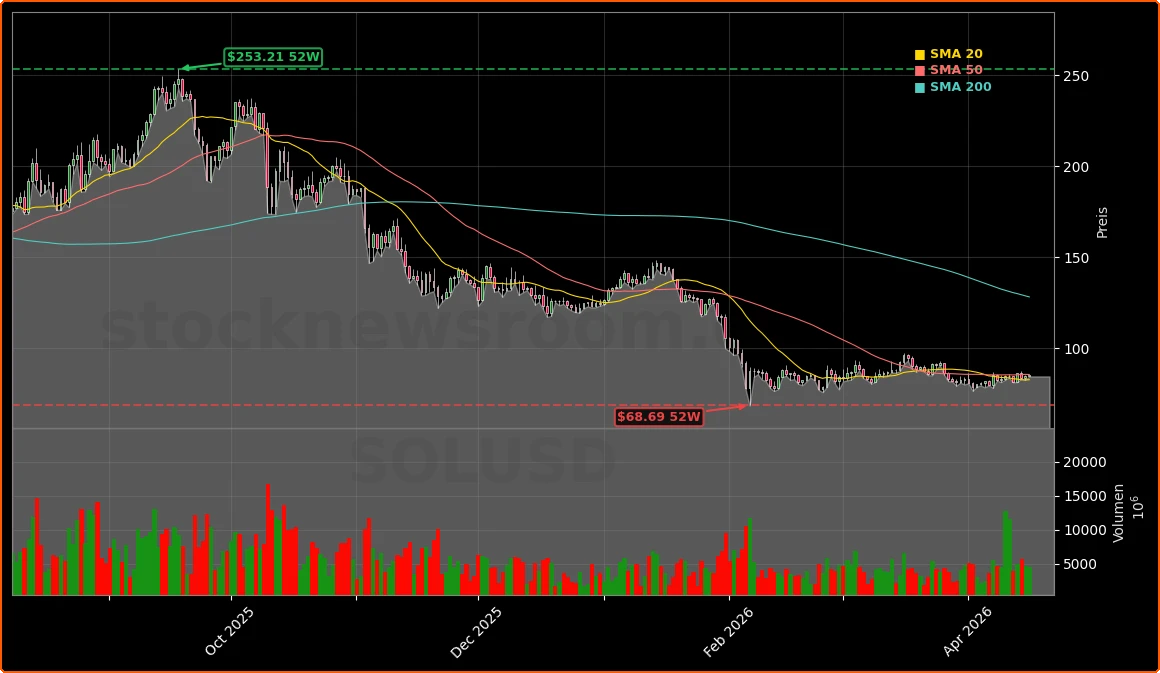
Crypto markets remain fragile in mid‑April, but **Solana (SOLUSD)** has started to repair recent technical damage. After sliding toward $82.50, the token found buyers and climbed back over $84–$85, now trading near $85.24, up roughly 1.8% versus the prior close around $84.93. On the hourly chart, Solana is holding above both the $85 level and the 100‑hour simple moving average, a first sign that short‑term momentum is shifting back to the bulls.
From a tactical Solana Market Analysis perspective, the recovery has already retraced more than half of the drop from the recent $87.74 swing high to the $82.74 low. A rising trend line around $85 is offering nearby support, with initial resistance emerging at $85.80 and then $86.50. The more important ceiling sits in the $88 area: a decisive break and hourly close above that zone could unlock a move toward $95, with some technical traders eyeing an extension toward $100–$102 if broader risk appetite improves.
However, the current bounce comes after roughly six months of declining prices for both Solana and XRP, underscoring that this is still a counter‑trend move within a larger consolidation. For portfolio managers on Wall Street who treat crypto as a satellite allocation alongside high‑beta NASDAQ names like NVIDIA and Tesla, Solana’s ability to hold above $85 in coming sessions will be a key gauge of whether selling pressure has finally exhausted.
What risks do Solana traders face now?
The bullish case hinges on holding a narrow support band. If Solana fails to clear the $85.80–$88 resistance area, the price remains vulnerable to a renewed pullback. Immediate support is clustered around $85, followed by $84 and then the recent pivot at $82.50. A daily close below $82.50 would weaken the current recovery setup and raise the odds of a slide toward roughly $77, which many short‑term traders treat as the lower boundary of the current risk‑reward range.
This creates a relatively clear trading map: upside potential in the $96–$100 region versus downside risk toward $77. Intraday indicators are mildly constructive, with the hourly MACD in positive territory and the RSI holding above 50, suggesting that dip‑buyers still have the upper hand for now. But volatility can spike quickly in crypto, and Solana’s recent resilience during geopolitical tensions has not fully insulated it from broader risk‑off swings that also pressure growth stocks on the S&P 500 and NASDAQ.
For U.S. investors who primarily trade equities and options, Solana’s current setup resembles a high‑beta tech name probing support after a sharp correction: attractive for active traders with clear stop levels, but less compelling for conservative, long‑only mandates. Institutional strategists at major banks such as Goldman Sachs and Morgan Stanley continue to frame large‑cap crypto as a speculative satellite rather than a core holding, and no major Wall Street desk has recently upgraded Solana‑linked products or issued fresh formal ratings.
How does the XRP hype affect Solana Market Analysis?
Beyond chart levels, sentiment around Solana was jolted this week by an unexpected wave of XRP‑related posts from the project’s official X account. A short “XRP” logo animation, followed by cryptic comments like “Time to flip the switch” and “We signed 589 NDAs,” triggered intense speculation in both communities. The figure “589” is a long‑running meme among XRP holders, often associated with outsized price ambitions, and Solana’s decision to reference it directly was widely interpreted as a deliberate nod to that crowd.
The viral thread drew heavy engagement from Solana ecosystem players such as Phantom, Raydium, and Kamino, with some accounts promoting a “Solana everything” narrative while XRP supporters responded in kind. Yet despite the social‑media frenzy, prices remained largely unaffected: XRP hovered around $1.41, up roughly 3.7%, while Solana added less than 1% to trade near the mid‑$80s. No formal partnership or cross‑chain initiative has been announced, and the posts currently look more like a high‑impact marketing play than a concrete product reveal.
From a disciplined Solana Market Analysis standpoint, that distinction is crucial. Meme‑driven spikes can drive intraday volume but rarely change long‑term valuation. The fact that Solana and XRP have both posted six consecutive months of declines suggests that traders are still demanding real catalysts—such as higher on‑chain activity, clearer regulatory progress in the U.S., or new institutional products—before assigning higher sustainable prices.
How does Solana stack up against other crypto plays?
Compared with mega‑cap tokens like Bitcoin and Ethereum, Solana offers higher volatility and, potentially, higher upside if risk sentiment turns. During recent geopolitical flare‑ups, Solana’s realized volatility over roughly six weeks actually undershot some equity benchmarks, including segments of the NASDAQ, highlighting that correlations are not static. Still, the asset remains firmly in the high‑risk bucket for diversified portfolios.
For investors already heavily exposed to growth names such as Apple, NVIDIA or Tesla, adding Solana increases portfolio beta even further. Unlike those S&P 500 and NASDAQ components, Solana does not benefit from recurring cash flows, established valuation frameworks, or traditional Wall Street coverage. Citigroup, RBC Capital Markets, and other major equity research houses currently focus their formal crypto views on Bitcoin and Ethereum‑linked vehicles, leaving Solana more squarely in the domain of specialist crypto funds and retail traders. That gap in coverage reinforces the need for technically driven risk management around clear levels like $88 on the upside and $77 on the downside.
In summary, today’s Solana Market Analysis points to a market in tactical recovery rather than in a confirmed new uptrend. Traders are watching whether the token can build on support at $82.50–$85 and challenge resistance at $88, with a potential path toward $95–$100 if momentum improves. The viral XRP engagement has energized community sentiment but has not yet translated into fundamental change, leaving the chart as the primary guidepost. For active traders comfortable with crypto risk, the coming days will show whether Solana can convert short‑term hype and technical stabilization into a more durable advance.