
Is Bitcoin’s latest breakdown a final washout before a rebound, or the first real warning of a deeper institutional retreat?

What’s Driving Bitcoin’s Breakdown Below $65,000?
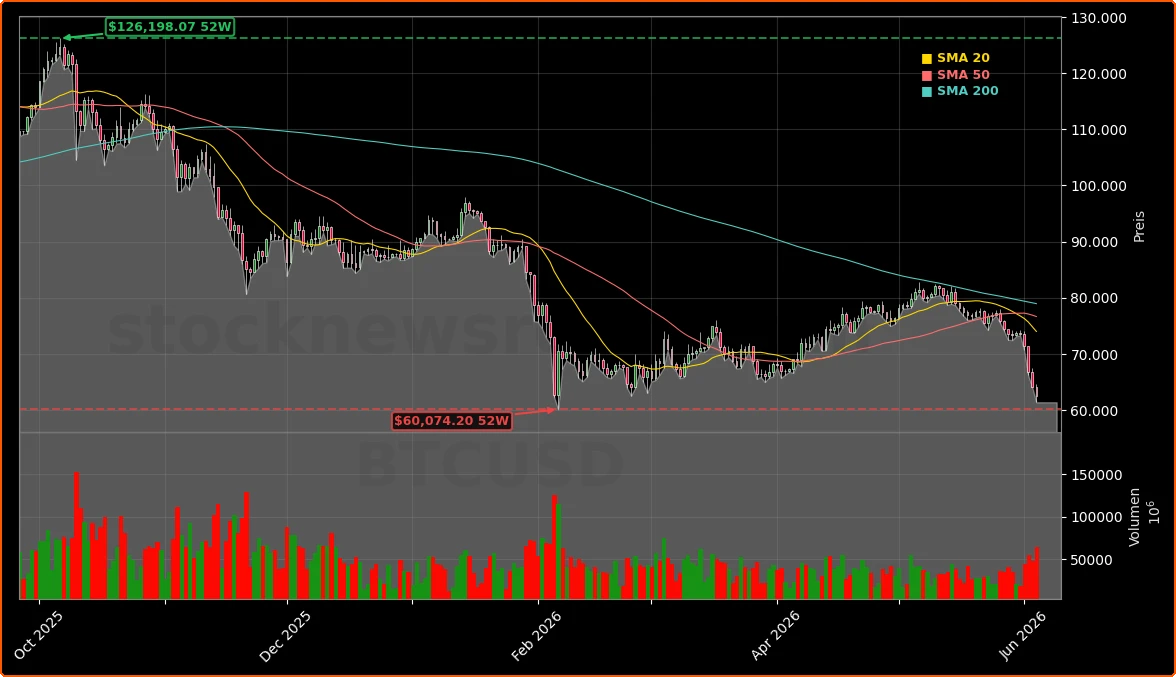
Bitcoin (BTC) has fallen 25% from its May peak near $82,650, breaching critical technical levels including the $72,000–$74,000 support zone — a range that anchored April–May’s rally. The drop accelerated after BlackRock’s IBIT ETF recorded its second-largest daily net outflow since inception, per The Block. Cumulative ETF outflows now total over $4.4 billion in just 13 trading days — the longest net outflow streak since launch, according to Bloomberg. This capital flight coincides with a sharp rotation into U.S. tech equities, where Apple and NVIDIA have outperformed Bitcoin by over 300 basis points in Q2 2026. The S&P 500’s tech-heavy composition and NASDAQ’s 12% YTD gain underscore why institutional portfolios are reweighting away from crypto and toward AI-driven earnings growth.
Is This Capitulation — or the Start of a Deeper Downtrend?
CryptoQuant data shows short-term holders realized losses at the fastest pace since February 6 — the last major capitulation event. On June 2 alone, Binance saw -16,400 BTC in STH losses, while total exchange inflows hit -38,700 BTC. Mid-sized investors added 8,400 BTC to Binance that day — the highest since February — confirming that selling isn’t just retail-driven. Yet the $64,500–$66,500 demand zone — tested and held in February — is now re-emerging as a potential floor. The 200-week simple moving average at $61,800 remains intact, a historically reliable cycle-bottom level from 2015, 2018, and 2020. If BTC holds above it, the bear flag pattern may fail — opening a path toward $70,000. If it breaks, the next target is $50,000–$52,000.
How Are U.S. Institutions Reacting to Bitcoin Market Analysis?
Wall Street’s stance is bifurcating. While Jane Street cut Bitcoin ETF exposure by 71% in Q1, Bank of America tripled its Ethereum and Solana ETF positions and raised its BTC ETF allocation to $37 million, per Bitget. Goldman Sachs analysts recently reiterated a ‘Neutral’ rating on crypto ETFs, citing ‘structural demand erosion’ but noting ‘regulatory clarity via the CLARITY Act could re-anchor institutional inflows by Q3.’ Meanwhile, Citigroup raised its 12-month BTC price target to $85,000 — contingent on U.S. Treasury’s Bitcoin reserve rollout and passage of the CLARITY Act. That bill, now in Senate markup, aims to resolve SEC/CFTC jurisdictional conflicts and could unlock pension and sovereign wealth fund participation.
What Role Does the U.S. Bitcoin Reserve Play?
U.S. Treasury Secretary Scott Bessent confirmed before the Senate Finance Committee that the strategic Bitcoin reserve — seeded with 328,372 BTC ($21.5 billion) from seized assets — is advancing ‘at maximum speed.’ Texas has followed with its own reserve legislation. Though no new purchases are planned, the reserve’s existence adds long-term price support and signals federal recognition of Bitcoin as a non-sovereign reserve asset. That framework matters to S&P 500 investors: if U.S. fiscal policy begins treating Bitcoin like a macro hedge, its correlation with Treasuries and the dollar could strengthen — a dynamic not yet priced in.
Bitcoin Market Analysis: What’s Next for U.S. Portfolios?
If BTC holds above the 200-week SMA at $61,800, the bear flag breakdown loses validity — and the path opens to retest $70,000.— RidaaXBT, crypto strategist
With $1.66 billion in total crypto liquidations in 24 hours — $737 million in BTC longs alone — volatility remains elevated. Yet the current environment mirrors February’s capitulation: oversold RSI (30.4), aggressive exchange inflows, and exhausted positioning. The key differentiator this time is macro pressure — rising 10-year yields, Iran conflict uncertainty, and the Federal Reserve’s ‘higher for longer’ stance. For U.S. investors, Bitcoin is no longer just a tech stock proxy — it’s a stress test for risk appetite across asset classes. Bitcoin Market Analysis suggests near-term stability hinges on ETF flow reversal and a hold above $61,800. A sustained break above $69,000 would confirm bottoming — and signal renewed institutional confidence.