Is the latest Bitcoin Price Plunge just a brief shakeout or the start of a deeper, ETF-driven risk-off phase?

How deep is the Bitcoin Price Plunge?
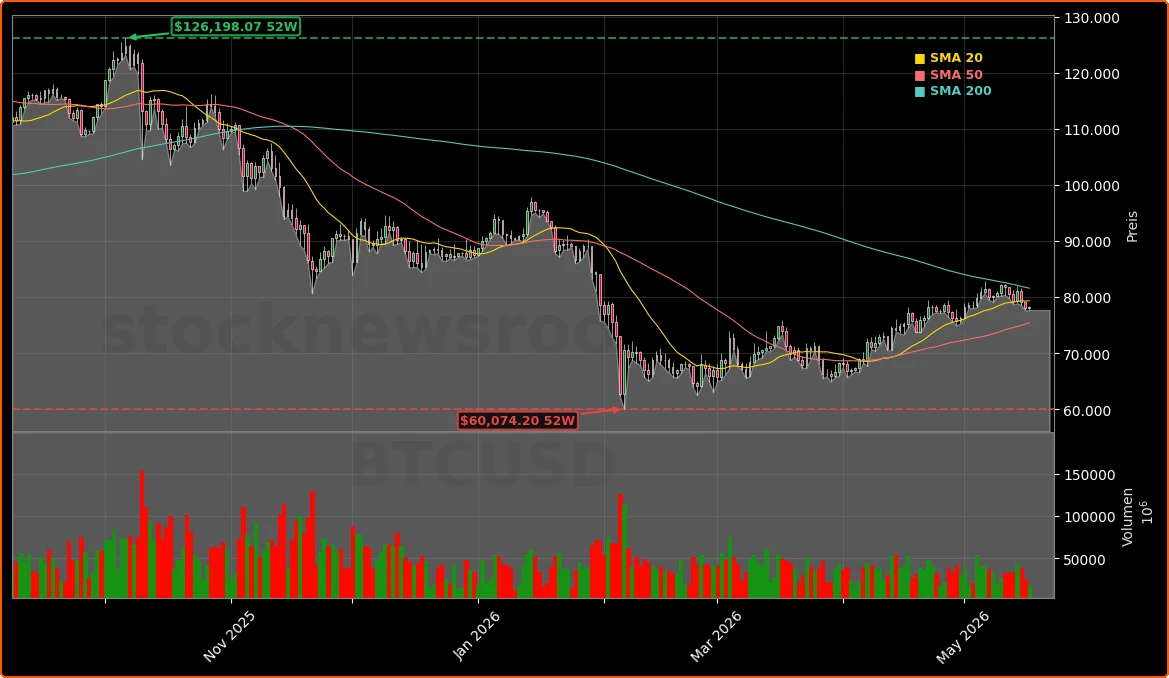
Bitcoin (BTC-USD) is changing hands around $78,200, modestly higher on the day and slightly above Friday’s intraday low near $77,700, but still well below the failed push through $82,000 earlier in the week. That rejection flipped $80,000 from a psychological floor into immediate resistance and set off a two‑day slide that briefly drove BTC inside the $77,700–$78,000 support band. The Bitcoin Price Plunge has knocked roughly 3.9% off prices since May 15, even as today’s quote of $78,205.92 sits just above Friday’s $78,000 pivot and only 0.29% above the prior close at $78,105.45.
Technically, the key battleground is the 200‑day moving average, now clustered around $82,300. Bitcoin has not closed above that level since January, leaving the current move decisively below the threshold many institutional desks use to distinguish a durable bull trend from a mid‑cycle rebound. A daily close back above $80,000 would break the short‑term lower‑low sequence and open the door to another test of $82,000, but a decisive drop under $77,700 would put $76,500 and then $75,000 in play as the next downside checkpoints.
Why are ETFs amplifying the selloff?
The Bitcoin Price Plunge is closely tied to a sharp reversal in U.S. spot Bitcoin ETF flows. After pulling in more than $2.4 billion in April and helping drive BTC toward its October 2025 record near $126,000, the ETF complex has swung to sizeable net outflows in May. Data for the week ending May 15 show roughly $1 billion exiting spot Bitcoin products, the largest weekly withdrawal since January and a clear break from the six‑week inflow streak that previously buffered downside volatility.
Daily figures highlight how fragile that demand has become. U.S. spot funds saw outflows of about $233 million on May 13, followed by only $27 million in inflows the next day and renewed redemptions near $290 million on May 15. StreetInsider reports that aggregate outflows reached roughly $635 million midweek, a move that coincided with BTC losing the $80,000 handle. Trading desks also point to Jane Street’s decision to cut its Bitcoin ETF holdings in major vehicles like BlackRock’s iShares Bitcoin Trust and Fidelity’s fund by 60–71% in Q1 as a sign that some sophisticated liquidity providers are rotating toward Ether exposure and select crypto‑equity plays.
For U.S. wealth managers, the message is that ETFs are no longer a one‑way institutional bid soaking up supply from miners and early holders. Instead, they have become a transmission channel: when Wall Street de‑risks around macro events or Fed repricing, ETF redemptions can rapidly translate into spot selling pressure, amplifying any Bitcoin Price Plunge.
How do macro risks and Wall Street correlations look?
The macro backdrop behind the current slide looks more like a classic risk‑off rotation than a crypto‑specific shock. Ten‑year U.S. Treasury yields are hovering between 4.5% and 5.1%, levels that significantly raise the opportunity cost of holding a non‑yielding asset like Bitcoin. At the same time, Brent crude trades around $109–$110 per barrel, keeping inflation expectations elevated and forcing the Federal Reserve to keep rate‑cut hopes on hold, if not consider renewed hikes.
That mix has hurt growth stocks on the NASDAQ and small caps in the Russell 2000, and BTC has traded in lockstep. Its 30‑day correlation with Nasdaq futures is above 0.7, while its sensitivity to equity drawdowns tends to spike when high‑beta names sell off. For investors already concentrated in mega‑cap tech such as NVIDIA, Apple and Tesla, this means Bitcoin is currently behaving less like digital gold and more like an additional layer of tech‑style volatility in a portfolio that is already heavily exposed to duration and growth risk.
Correlations matter for asset allocators: the tighter BTC moves with Wall Street benchmarks, the weaker the case for treating it as a diversifier during equity stress. Until yields retreat and oil prices cool, the macro headwinds that triggered the recent Bitcoin Price Plunge are likely to keep limiting upside attempts through $82,000.
What catalysts could reverse the Bitcoin Price Plunge?
Despite the setback, several medium‑term drivers could help Bitcoin reclaim lost ground. First, any pullback in the 10‑year yield below 4.5% combined with a slide in Brent crude back toward $90 would ease pressure on risk assets and weaken the dollar, conditions that historically support BTC breakouts. Second, a return to consistent spot Bitcoin ETF inflows would signal that institutional capital is once again absorbing sell pressure near the 200‑day moving average instead of adding to it.
Regulation is another key swing factor. Progress on the U.S. CLARITY Act, which targets clearer rules for digital asset custody and balance‑sheet treatment, has already reduced some of the uncertainty keeping pension funds and sovereign wealth funds sidelined. A successful Senate floor vote in June or July, aligned with a renewed wave of ETF demand, could give BTC the institutional catalyst it needs to close above $82,300 on a weekly basis before the end of Q2. Until then, traders will watch the $77,700–$78,000 shelf: holding that zone preserves the case for a controlled correction, while a clean break lower would confirm that the current Bitcoin Price Plunge has further to run.