
Is silver’s sharp bounce the start of a real turnaround, or just another trap inside a much bigger downtrend?

Is XAGUSD Silver Analysis Signaling a True Bottom?
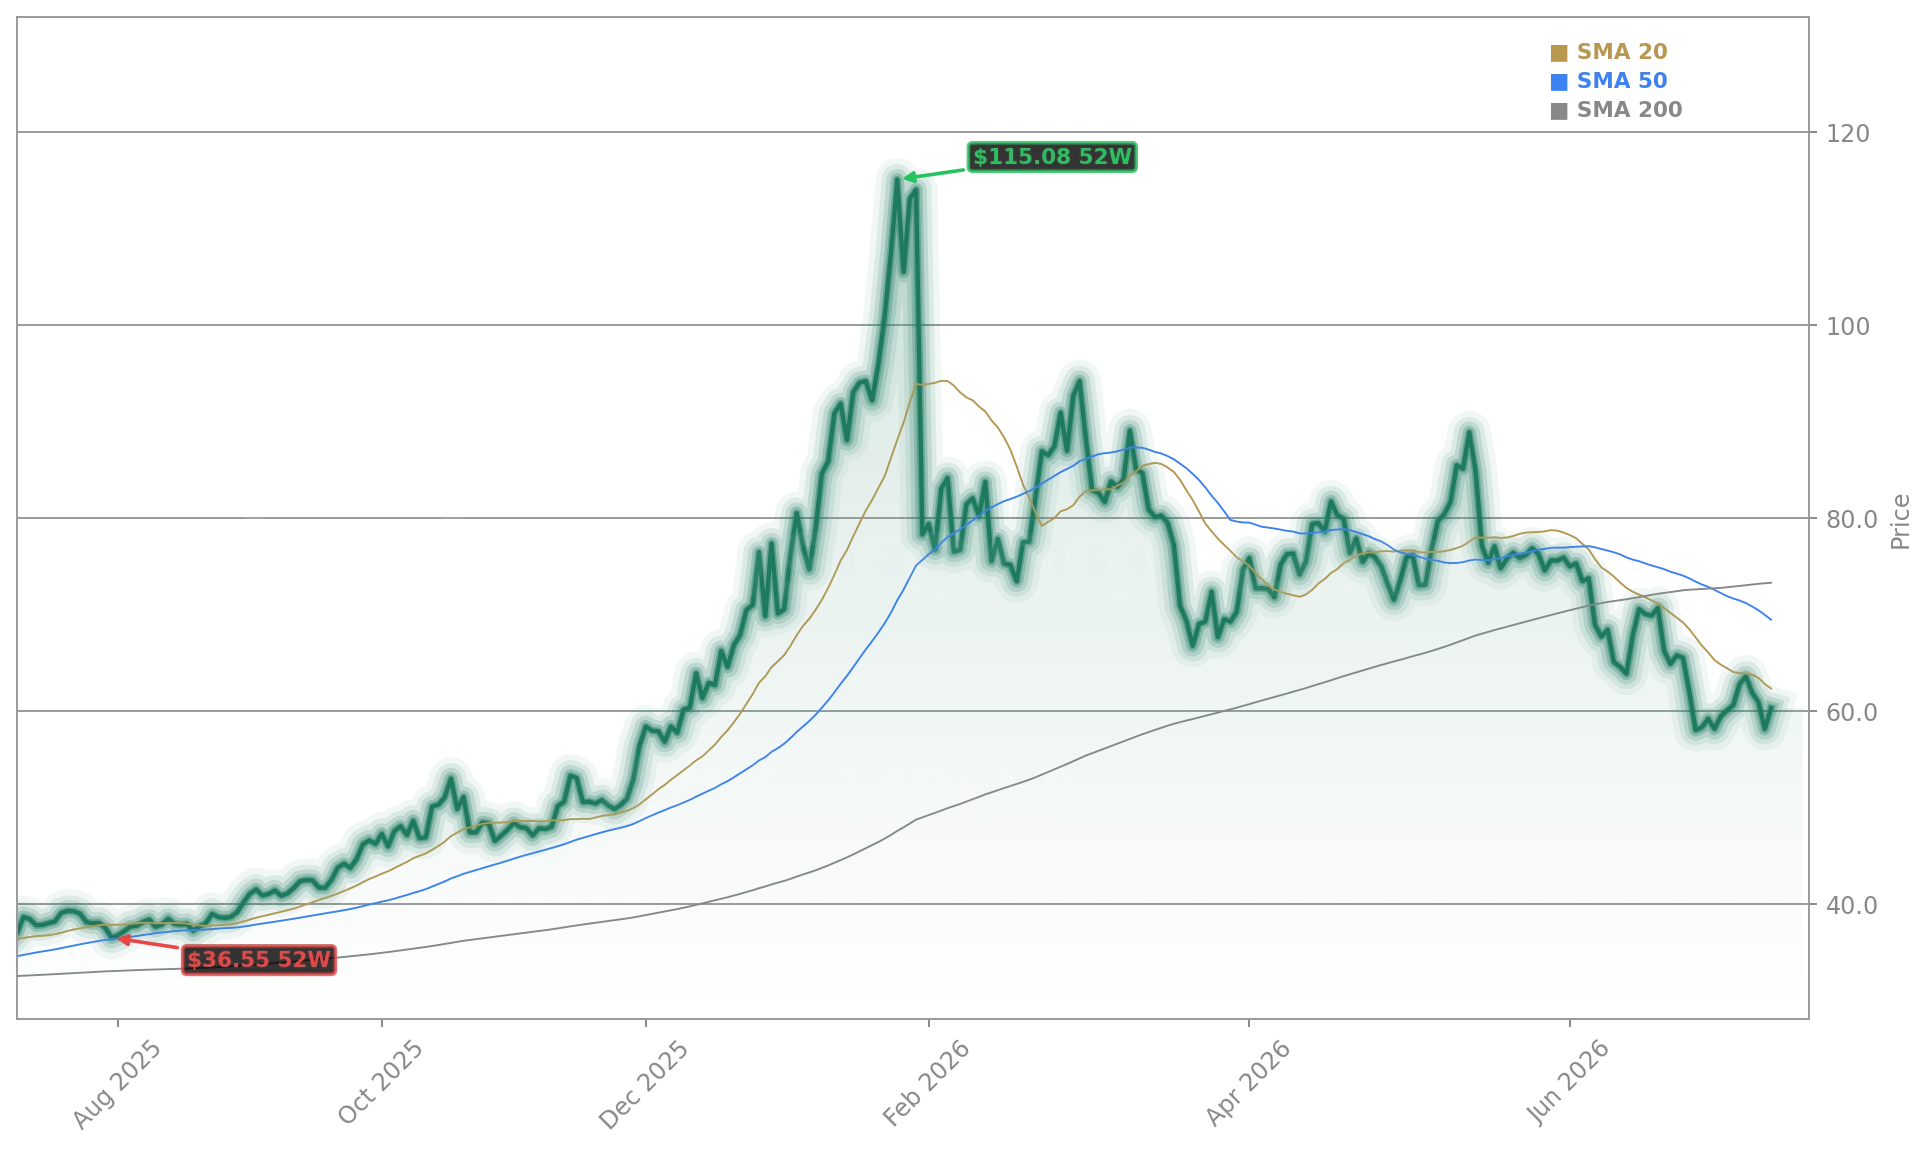
Silver’s rebound — up $1.86 from yesterday’s close — follows a brutal 54% decline from its all-time high of $121, a drawdown that now ranks among the steepest in modern precious metals history. With the current price still 51% below that peak and 22% below its 52-week high of $77.30, the rally is not yet confirming a structural reversal. Technical analysts at Morgan Stanley note that the $60–$63 zone represents a critical confluence: the 50-day moving average, prior resistance-turned-support, and the 38.2% Fibonacci retracement of the full bearish leg. Yet the volume surge behind the move — trading volume spiked to 3.77 billion contracts on July 7 — mirrors patterns seen at prior major tops, raising caution flags. That volume spike, per Bloomberg data, exceeded the 2020 and 2021 peaks, reinforcing concerns that the rally may lack sustainable institutional backing.
What Do Major Banks Say About XAGUSD?
Citigroup has lifted its 3-month XAGUSD target to $68, citing improving ETF inflows and growing safe-haven demand amid rising geopolitical risk in the Middle East and Eastern Europe. In contrast, RBC Capital Markets maintains its ‘Underperform’ rating and has lowered its 6-month price target to $47, arguing that a strengthening U.S. dollar — now rebounding within its long-term trend channel — poses a structural headwind. ‘The DXY’s bottoming pattern and imminent rally are textbook silver-negative catalysts,’ said RBC’s commodities strategist in a July 8 note. Goldman Sachs, meanwhile, takes a neutral stance: ‘We see $60–$65 as a high-probability consolidation range, but a decisive close above $66.50 would materially improve the odds of a $70 test by late Q3.’
How Does Silver Compare to Gold and Equities?
While gold (XAUUSD) has held relatively steady near $2,340, silver’s volatility remains extreme — its beta to the S&P 500 is now 1.8, up from 1.3 in early 2026. That amplifies its sensitivity to both risk sentiment and dollar strength. Notably, silver’s underperformance has widened against both NVIDIA and Apple, whose AI-driven earnings momentum continues to lift the NASDAQ to record highs. Meanwhile, industrial demand signals remain mixed: solar panel manufacturers report rising silver usage per watt, yet silver-intensive sectors like photovoltaics face margin pressure from higher interest rates — a headwind for long-term capital allocation. The divergence underscores why many macro hedge funds are treating XAGUSD as a tactical, not strategic, allocation.
What’s Next for U.S. Investors?
For U.S. portfolios, the XAGUSD Silver Analysis hinges on three near-term catalysts: the July 15 FOMC meeting minutes, the upcoming U.S. CPI print on July 16, and the DXY’s next directional break. A sustained DXY move above 106.50 would likely reaccelerate silver’s downside, potentially reopening the path toward the $39.41 upper boundary of the long-term accumulation zone cited by several technical strategists. Conversely, a dovish CPI print combined with a DXY reversal could propel XAGUSD toward $70 — a level that would test resistance near the 200-day moving average and trigger short-covering. Importantly, silver’s correlation with Tesla-linked battery metals remains weak, suggesting limited spillover from EV supply chain dynamics in the near term.
The DXY’s bottoming pattern and imminent rally are textbook silver-negative catalysts.— RBC Capital Markets commodities strategist
Related Coverage: For a deeper dive into silver’s positioning extremes, see Silver Bottoming Analysis: Is XAGUSD Near a -4.2% Reversal?. Investors assessing broader commodity risk should also review WTI Hormuz Escalation: 14 Tankers Trigger Oil Warning, which outlines how energy supply shocks could indirectly influence dollar strength and, by extension, XAGUSD.