
Is Bitcoin finally building a durable floor, or is this rebound just another trap before the next volatility spike?

What triggered Bitcoin’s rally this week?
Bitcoin (BTC/USD) surged after the US Labor Department reported June nonfarm payrolls growth of just 128,000 — well below the 190,000 consensus — while unemployment ticked up to 4.2%. The data cooled Treasury yields and boosted equity futures, with the NASDAQ up 1.3% in after-hours trading. Crucially, the move coincided with a confirmed $980 million institutional Bitcoin acquisition, per Bloomberg, signaling renewed confidence in digital assets as a hedge against policy uncertainty. Unlike the 2022–2023 bear market — where BTCUSD collapsed on rising rates — today’s rally reflects a recalibration: falling inflation pressure and weakening labor momentum are now bullish catalysts for risk assets, including Bitcoin.
How does Bitcoin Market Analysis inform S&P 500 positioning?
Bitcoin’s recovery is not occurring in isolation. It’s unfolding alongside a notable divergence: while the S&P 500’s tech-heavy index rose 4.7% in Q2 2026, Bitcoin (BTC/USD) declined nearly 18% — a gap now narrowing. Analysts at Morgan Stanley note that Bitcoin’s 30-day correlation with NASDAQ has rebounded to 0.68 from 0.31 in May, suggesting renewed co-movement with growth equities. This matters for portfolio construction: investors holding NVIDIA and Apple may find Bitcoin an increasingly effective volatility hedge during Fed uncertainty — especially as zero-knowledge proofs and AI-integrated micropayments gain traction in enterprise pilots. Citigroup recently raised its 12-month BTCUSD price target to $75,000, citing ‘structural inflows from pension-linked digital asset mandates’.
Is the bottom in for Bitcoin (BTC/USD)?
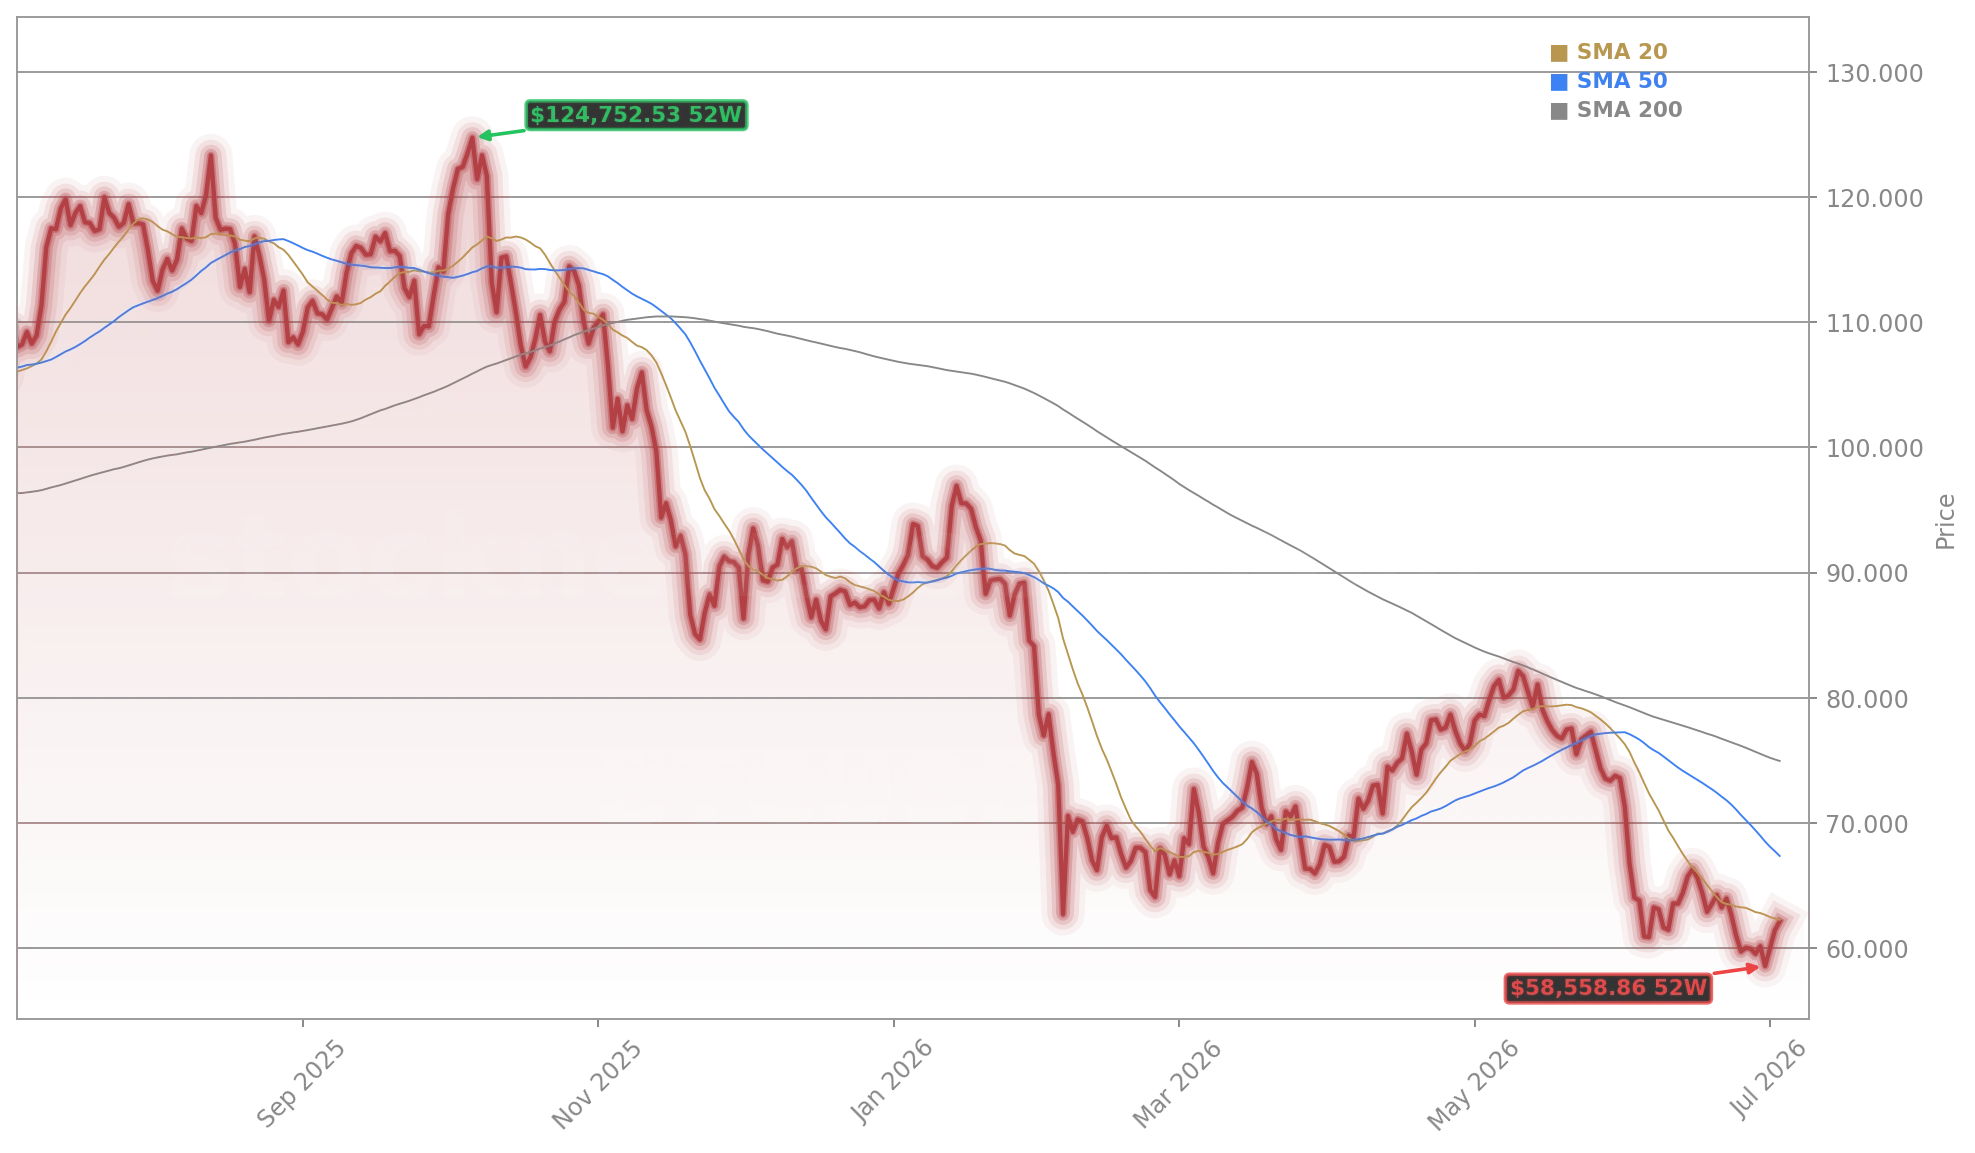
Bitcoin has spent the past five months consolidating between $56,000 and $64,000 — a range that now appears structurally supported. Mining difficulty has fallen 20% since February, reducing sell pressure from unprofitable operators. Meanwhile, on-chain data shows net inflows into long-term holding addresses have accelerated for three consecutive weeks. RBC Capital Markets emphasizes that ‘the $56,000 level is now a validated floor’ — a view echoed by Goldman Sachs, which upgraded Bitcoin to ‘Overweight’ in early June. Importantly, this bottoming process contrasts sharply with NFTs and altcoins, which remain 63% below their 2021 peaks. That divergence strengthens Bitcoin’s case as the sole crypto asset gaining institutional traction.
What’s driving institutional demand now?
Beyond macro tailwinds, Bitcoin’s utility narrative is evolving. Investor Katie Hahn highlighted how AI-driven ‘agentic commerce’ — autonomous agents transacting in real time — demands instant, low-cost, verifiable micropayments. Blockchain infrastructure, particularly Bitcoin Layer 2 solutions with zero-knowledge proofs, is now being stress-tested in pilot programs with major financial and logistics firms. This shift from ‘store of value’ to ‘settlement layer for AI agents’ adds a new dimension to Bitcoin Market Analysis. Additionally, South Korean retail capital — historically ~30% of global crypto volume — has rotated into leveraged semiconductor stocks, amplifying the recent decoupling between KOSPI and Bitcoin. That flow reversal may now be reversing: Korean exchange inflows jumped 42% week-over-week, per data from CryptoQuant.
What risks remain for Bitcoin investors?
Short-term caution remains warranted. Technical analysts at J.P. Morgan warn of a potential ‘bull trap’ if BTCUSD rallies toward $70,000–$72,000 without sustained volume — a scenario that could trigger a sharp pullback. The futures market still shows elevated short positioning, and leverage remains elevated relative to spot liquidity. Yet sentiment indicators — including the Crypto Fear & Greed Index — have risen from ‘Extreme Fear’ (18) to ‘Greed’ (67) in just 12 days. That shift, combined with the $1 billion institutional buy and Fed dovish repricing, suggests momentum is now firmly on the bulls’ side — at least through Q3 2026.
The $56,000 level is now a validated floor — this isn’t just technical support, it’s structural.— RBC Capital Markets
Related Coverage: Bitcoin adoption is accelerating globally, with retail platforms expanding access and institutional capital building quiet, strategic positions — as detailed in Bitcoin Crypto Adoption Gets $1B Boost From Global Expansion. That momentum aligns with broader infrastructure investments in digital asset custody, settlement, and AI-integrated finance — a theme also explored in Bitcoin Crypto Adoption Gets $1B Boost From Global Expansion.