

Is Bitcoin quietly building a bottom while Wall Street heads for the exit?

Why Is Bitcoin (BTC/USD) Under Pressure?
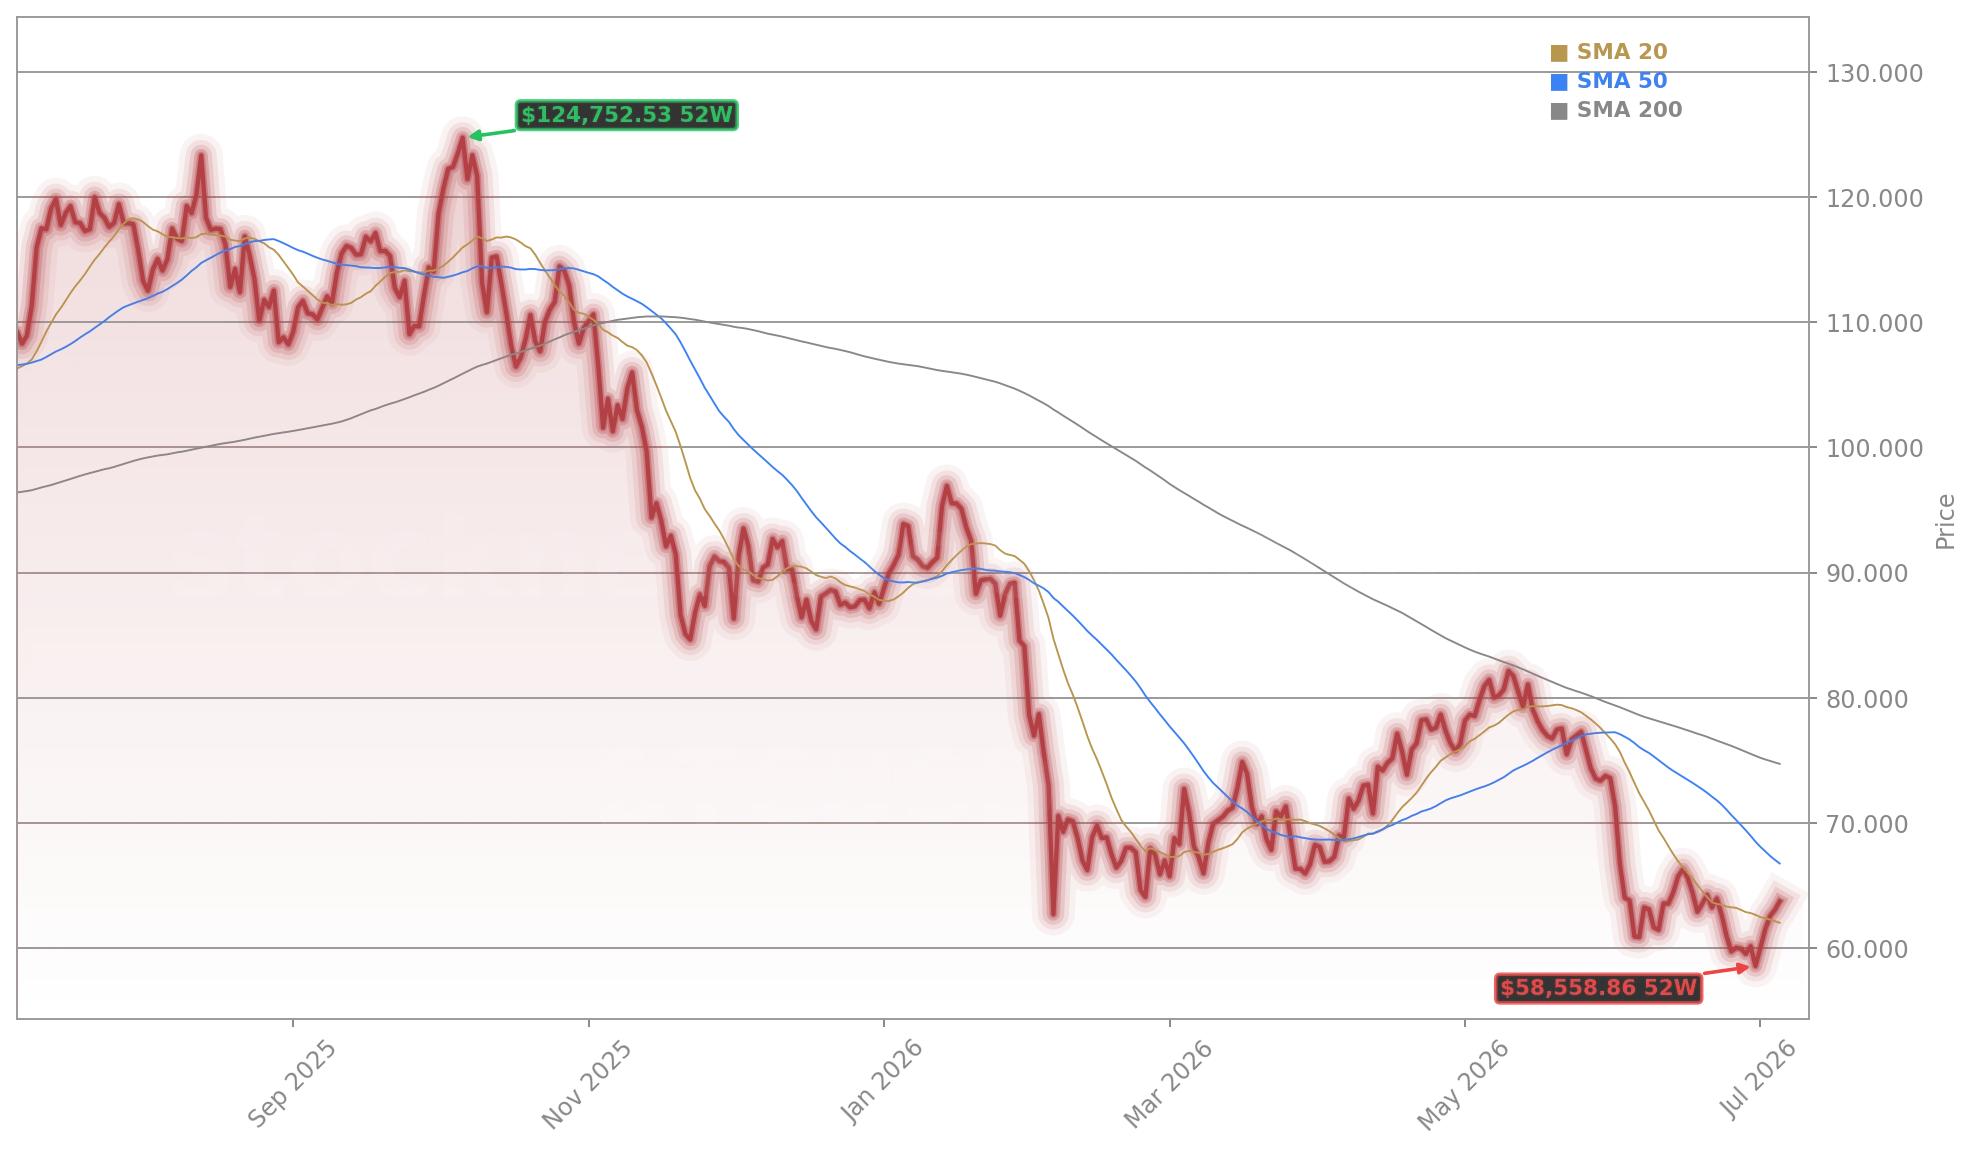
Rising macro uncertainty continues to weigh on Bitcoin (BTC/USD). Stronger-than-expected Q2 GDP data and elevated PCE inflation readings have reinforced expectations of a more persistent Fed policy stance — lifting the U.S. dollar index and pushing 10-year TIPS yields to their highest since early 2025. As a non-yielding, long-duration asset, Bitcoin faces headwinds when real rates climb. This dynamic explains much of the 50% peak-to-trough decline since October’s bear market onset — a correction amplified by leveraged futures unwinding and spot-derivatives mismatches. Notably, the current price remains well below its 52-week high of $126,000, underscoring the severity of the drawdown.
What Do ETF Outflows Signal for Wall Street?
U.S.-listed Bitcoin ETFs recorded $4.3 billion in net outflows during June — the largest monthly outflow since inception. This reflects not just retail retrenchment but institutional recalibration amid rising opportunity cost. For comparison, the S&P 500 delivered a 9.2% YTD return through June, while Bitcoin (BTC/USD) is down nearly 50% from its all-time high. The outflows contrast sharply with activity in Europe, where platforms like Revolut report steady crypto transfer usage — though not speculative trading. For U.S. investors, this divergence highlights growing competition for capital between traditional equities and digital assets. Notably, Bitcoin ETF Outflows Hit $4.3B as Whale Buying Builds examines whether this is a liquidity shakeout or a structural shift.
Are Whales Setting Up a Bottom?
Yes — and the data is compelling. Whale wallets accumulated 270,000 Bitcoin at an average price of $59,000 in June, per on-chain analytics cited by Bloomberg. That’s roughly 1.4% of the total circulating supply, acquired precisely as ETF flows turned negative and sentiment hit multi-month lows. This accumulation coincides with Bitcoin (BTC/USD) holding firm above $60,000 — a level historically associated with long-term holder capitulation. While retail investors remain psychologically strained — with an estimated average cost basis near $80,000 — strategic buying by large, informed participants suggests a potential inflection point. This Bitcoin Market Analysis views whale behavior as a stronger signal than ETF flows alone, given their historical correlation with subsequent 6–12 month rallies.
How Does This Compare to Broader Tech and Digital Asset Trends?
Bitcoin’s struggle stands in contrast to strength in AI- and infrastructure-linked equities. NVIDIA shares are up 34% YTD, while Tesla and Apple have posted solid gains amid AI integration and services growth. The NASDAQ Composite has outperformed Bitcoin (BTC/USD) by over 85 percentage points this year — reinforcing the asset’s current role as a speculative, high-beta instrument rather than a mainstream portfolio hedge. Meanwhile, crypto-native firms like Robinhood are building full DeFi stacks, and Venice AI’s $65 million Series A round signals continued venture confidence in blockchain-adjacent infrastructure. Still, no major U.S. tech firm has yet launched a Bitcoin treasury program — unlike MicroStrategy, whose $11.5 billion holding remains the largest corporate position. Citigroup analysts recently reiterated their ‘Neutral’ rating on Bitcoin-related equities, citing valuation risk amid macro uncertainty.
Bitcoin Market Analysis: What’s Next for U.S. Investors?
Bitcoin Market Analysis points to a near-term range-bound environment — $60,000 to $68,000 — with breakout potential contingent on two catalysts: a dovish Fed pivot or sustained whale accumulation above $62,000. Morgan Stanley analysts warn that failure to reclaim $65,000 by late July could extend consolidation into Q3. Conversely, RBC Capital Markets notes that ETF outflows tend to peak 2–3 weeks before institutional re-entry — suggesting late July or early August as a watch window. For U.S. portfolios, exposure remains best deployed via selective, dollar-cost-averaged entry rather than tactical timing. This Bitcoin Market Analysis concludes that the asset’s structural utility is intact, but its price action is now tightly coupled to macro policy — making it a barometer for Fed credibility and dollar strength.
Whale accumulation at $59,000 is not noise — it’s data. This is where the next cycle often begins.— Bloomberg Crypto Analyst
Related coverage includes Bitcoin ETF Outflows Hit $4.3B as Whale Buying Builds, which explores whether current outflows represent final capitulation or a broader liquidity migration. That article complements today’s Bitcoin Market Analysis by examining on-chain accumulation patterns alongside institutional fund flows — offering a dual-lens view for U.S. investors navigating volatility.