Why did the Carvana Used-Car Market tumble nearly 10% when Carvana itself delivered strong results?

Why Did Carvana Co. Drop Without Catalyst?
Carvana Co. shares fell sharply in pre-market and extended losses throughout the trading day, closing at $63.40 — down $6.64 from Tuesday’s $70.04 close. The move occurred despite Carvana Co. reporting strong Q4 2025 results: $4.22 in EPS and $5.6 billion in revenue, up 58% year over year. The selloff was entirely sector-driven, with CarMax’s (KMX) earnings report serving as the catalyst. CarMax beat earnings estimates but warned of narrowing per-unit gross margins and elevated credit-loss reserves — a red flag for Carvana Co., which carries $4.83 billion in long-term debt and relies heavily on securitization markets sensitive to subprime auto loan performance. Analysts at RBC Capital Markets noted that ‘Carvana’s balance sheet remains vulnerable to any sustained deterioration in used-car credit quality.’
How Is the Carvana Used-Car Market Linked to CarMax?
Carvana Co. and CarMax are the two largest pure-play used-car retailers on the NASDAQ and NYSE, respectively, and historically trade with a 0.78 beta correlation on sector news. When CarMax flags margin compression — as it did this week — Wall Street treats Carvana Co. as a higher-leverage, higher-volatility proxy. That dynamic was evident Wednesday: while CarMax fell 5.2%, Carvana Co. dropped nearly twice as much. The Carvana Used-Car Market is particularly sensitive to wholesale price trends, and CarMax’s commentary confirmed a 3.1% sequential decline in average used-vehicle selling prices — the steepest drop since Q3 2023. This directly challenges bullish narratives anchored in rising used-car values, a key pillar of recent upgrades from Citigroup and Goldman Sachs.
Are Options Signals a Contrarian Buy Signal?
Despite the selloff, Carvana Co.’s options activity suggests growing institutional conviction. Its 10-day put/call volume ratio hit 2.08 across ISE, CBOE, and PHLX — higher than 94% of readings over the past year. According to Schaeffer’s Senior Quantitative Analyst Rocky White, this signal has preceded one-month gains 70% of the time over the past three years, with an average return of 24.4%. Carvana Co. also exhibits short-squeeze potential: 72.22 million shares sold short represent 11.6% of float, requiring over five days to cover at average volume. Meanwhile, Carvana Co.’s Schaeffer’s Volatility Index (SVI) sits in the 22nd percentile — signaling near-term options are unusually cheap relative to historical implied volatility.
What’s Next for Carvana Co. and the Carvana Used-Car Market?
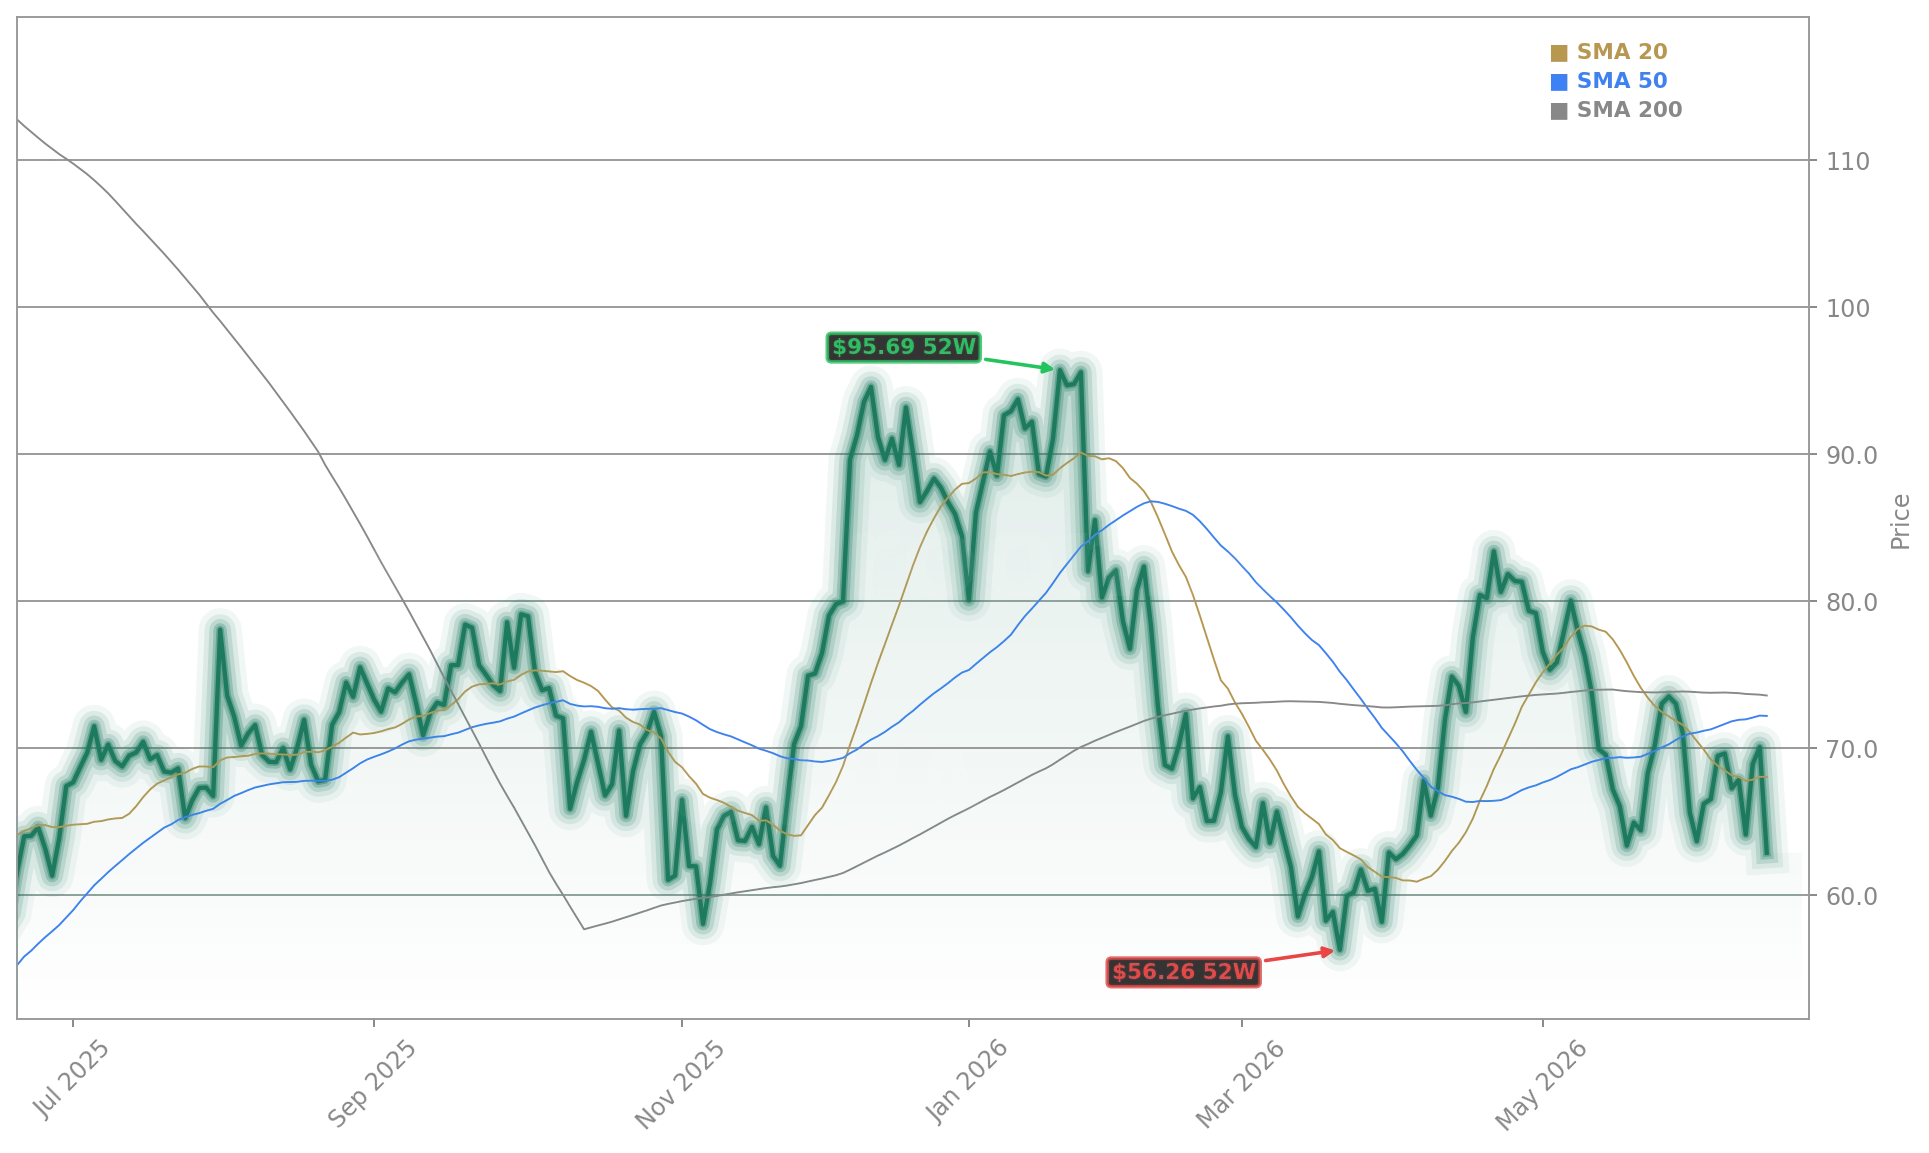
Carvana Co.’s next major catalyst is its Q2 2026 earnings release, expected in late July. Until then, the stock will likely continue trading as a barometer for the Carvana Used-Car Market — amplifying peer news, credit data, and macro trends like Fed policy and auto loan delinquency rates. Morgan Stanley recently reiterated its ‘Overweight’ rating but lowered its price target to $78 from $85, citing ‘increased uncertainty around used-vehicle pricing durability.’ Meanwhile, J.P. Morgan upgraded Carvana Co. to ‘Neutral’ last week, emphasizing ‘strong unit economics but rising balance sheet risk.’ With the S&P 500 up 12% year to date and the NASDAQ surging on NVIDIA and Apple strength, Carvana Co. remains one of the few large-cap names still down double digits in 2026 — a potential outlier if sector sentiment stabilizes.
Carvana’s balance sheet remains vulnerable to any sustained deterioration in used-car credit quality.— RBC Capital Markets
Related Coverage: The latest Carvana Short Report: -3.7% Plunge and Split Warning examines structural risks in Carvana Co.’s capital structure amid rising short interest. Meanwhile, Amazon Quantum Computing: 7-Year AWS Boom Takes Shape highlights how infrastructure investments by tech giants like Amazon could indirectly reshape auto retail financing via cloud-based risk modeling platforms — a long-term tailwind for data-driven players in the Carvana Used-Car Market.